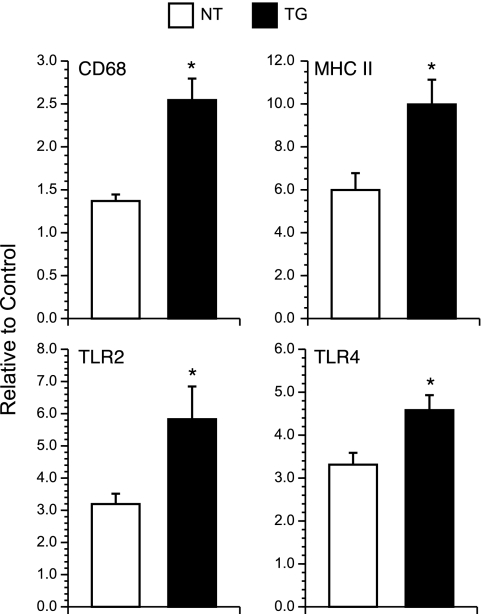
FIG. 8.
Transcript levels for CD68, MHC II, TLR2, and TLR4 in total brain RNA of infected and sham-infected control NT and TG mice. Samples were collected at 5 days p.i. The RNA was analyzed by real-time RT-PCR, adjusted for 18S RNA levels, and results from infected mice expressed as n-fold changes relative to the basal expression that was detected in the corresponding uninfected control group. Results are expressed as means ± standard errors of the means. Statistically significant differences (P < 0.05, ANOVA) are represented by asterisks.

