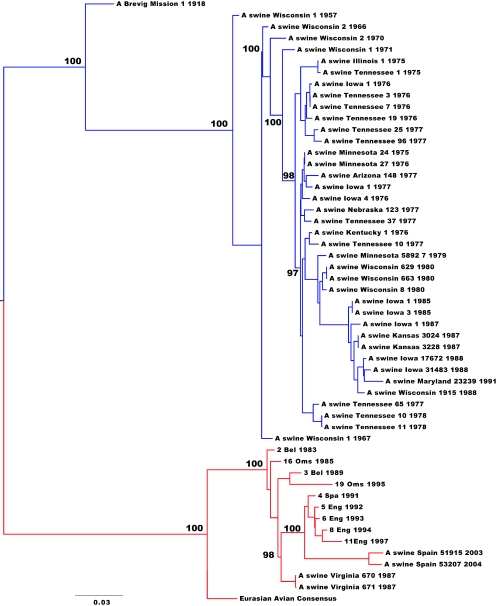
FIG. 1.
Maximum likelihood tree of concatenated genome sequences (54 whole genomes) of European and classical swine H1N1 IAVs. Horizontal branch lengths are drawn to scale (nucleotide substitutions per site). Bootstrap values (>75%) are shown next to the relevant nodes. The tree is midpoint rooted for clarity only. Classical swine H1N1 viruses are in blue, and European swine H1N1 viruses are in red.

