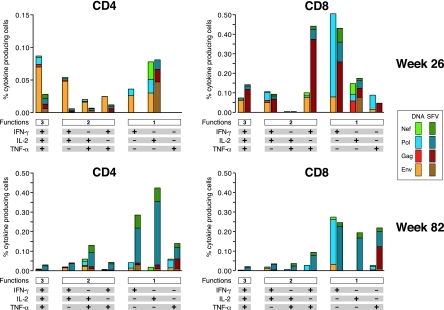
FIG. 4.
Functional profiles of vaccine-induced antigen-specific CD4+ and CD8+ T cells. The results shown are from five animals of each group (DNA/NYVAC-C and SFV/NYVAC-C) at week 26 and week 82. Responses are grouped on the basis of the number of functions (producing one, two, or three cytokines simultaneously). All the possible combinations of cytokine responses are shown on the x axis. The responses to vaccine antigens (Env, Gag, Pol, and Nef) are color coded. Bars correspond to the mean number of different functionally distinct antigen-specific CD4+ or CD8+ T cells per group. Background responses have been subtracted.

