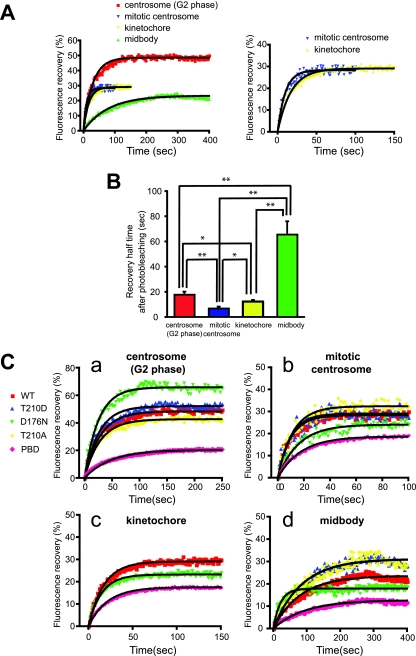
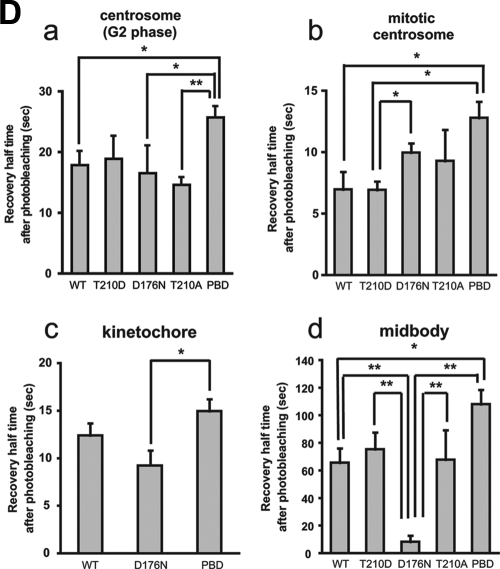
FIG. 2.
FRAP analysis of Plk1 at centrosomes, kinetochores, and midbodies. (A) Centrosomes during interphase and mitosis, kinetochores, and midbodies were targeted for laser photobleaching and monitored by fluorescence time-lapse microscopy. Photobleaching was performed at 100% laser transmission by scanning the bleached region of interest. Recovery intensity data were collected at 6% laser transmission at 1- or 2-s intervals. The data points represent the means from 7 to 17 experiments (see Table 1), with ≥30 cells measured in each experiment. Black curves were fitted to data by using GraphPad Prism software. The right panel shows the enlarged plotted intensities and fitted curves of mitotic centrosomes and kinetochores. (B) The 50% recovery times were calculated from each data curve from independent experiments. Mean values are indicated with bar graphs (G2 phase centrosomes [red], mitotic centrosomes [blue], kinetochores [yellow], or midbodies [green]). Error bars indicate the SEM. (C) FRAP for EGFP-Plk1 WT (WT) and mutants localized at G2 (a) and mitotic centrosomes (b), kinetochores (c), and midbodies (d) was performed as described in panel A. The fluorescence intensities after photobleaching are plotted (WT [red squares], T210D [blue triangles], D176N [green triangles], T210A [yellow diamonds], or PBD [pink diamonds]). Each data point represents the mean of 5 to 19 experiments, with ≥25 cells measured in each experiment. (D) The 50% recovery times for Plk1 localized at G2 centrosomes (a), mitotic centrosomes (b), kinetochores (c), and midbodies (d) were calculated from each data curve from independent experiments. Averages are indicated in the bar graphs with error bars showing the SEM. Statistically significant differences are indicated by asterisks (*, P < 0.05; **, P < 0.01).


