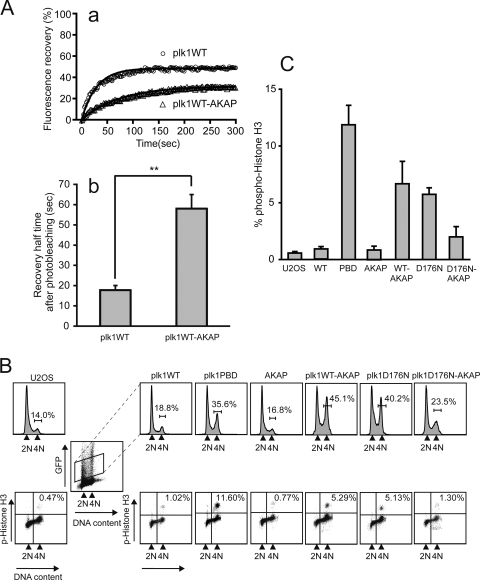
FIG. 4.
Expression of Plk1-AKAP induces mitotic arrest. (A) The dynamics of EGFP-Plk1 or EGFP-Plk1-AKAP at the centrosome in transfected U2OS cells were analyzed by FRAP. Average fluorescence recovery curves (a) and 50% recovery times after photobleaching (b) are shown. Each data point represents the mean of 14 and 11 experiments, respectively, in which >30 cells were imaged in each experiment (see Table 1). The black curves in subpanel a show the best single exponential fits to the data. Error bars in subpanel b indicate the SEM with statistically significant differences are indicated by asterisks (**, P < 0.01). (B) FACS profiles of DNA content and phospho-histone H3 staining in Plk1 and Plk1-AKAP cells. U2OS cells were transfected with the indicated EGFP-fused constructs for 24 h and then arrested with a thymidine block for an additional 24 h. At 24 h after release of the block, progression through the cell cycle was analyzed by FACS. Upper panels show the DNA profiles (PI) from control (U2OS) cells or from the transfected cells when gated for low to moderate EGFP expression (boxed). Lower panels show the phospho-histone H3 levels in the GFP-positive cells. The results from a typical experiment are shown. (C) Expression of either the PBD, a WT form of Plk1 that is tethered to the centrosome, or a freely diffusible kinase-dead Plk1 causes mitotic arrest. The average percentage of phosphohistone H3-positive cells in the GFP-expressing population from three independent experiments was determined. Error bars represent the standard deviations.

