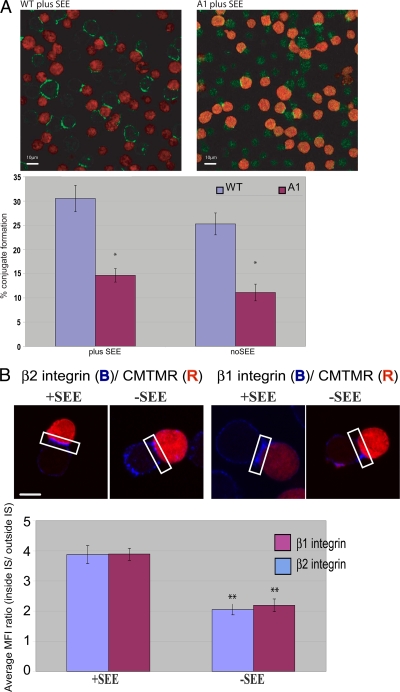
FIG. 7.
Conjugation and integrin accumulation at the IS with Raji APC. (A) Raji cells were labeled with CMTMR orange dye and incubated in the presence or absence of the superantigen SEE. WT or β1 integrin-deficient Jurkat (A1) cells were incubated at a 1:1 ratio with CMTMR-stained Raji (red) for 30 min at 37°C. The conjugates were fixed in solution and stained with anti-LFA-1 integrin (green). The graph shows the percentage of WT and A1 conjugates; the percent conjugates is the number of conjugates in a field/total number cells in field for each cell line. The data were collected from three independent experiments (n = 10 fields). Each bar presents the percent conjugates ± standard errors of the means. Asterisks indicate any statistically significant difference between the WT and A1 cells in the presence or absence of superantigen (*, P < 0.005). Scale bars = 10 μm. (B) Raji cells were labeled with CMTMR and incubated in the presence or absence of the superantigen SEE. WT Jurkat T cells were incubated at a 1:1 ratio with CMTMR-stained Raji (red) for 30 min at 37°C. The conjugates were fixed in solution and stained for β1 integrin or LFA-1 and then analyzed by confocal microscopy. The graph shows the manually masked mean fluorescence intensity (MFI) ratio at the membrane only (inside IS/outside IS). The data were collected from three independent experiments (n = 12 cells). Each bar presents the mean fluorescence intensities ± standard errors of the means. (**, P < 0.005 by t test for the difference between −SEE and +SEE for both integrin subtypes). Scale bar = 5 μm.

