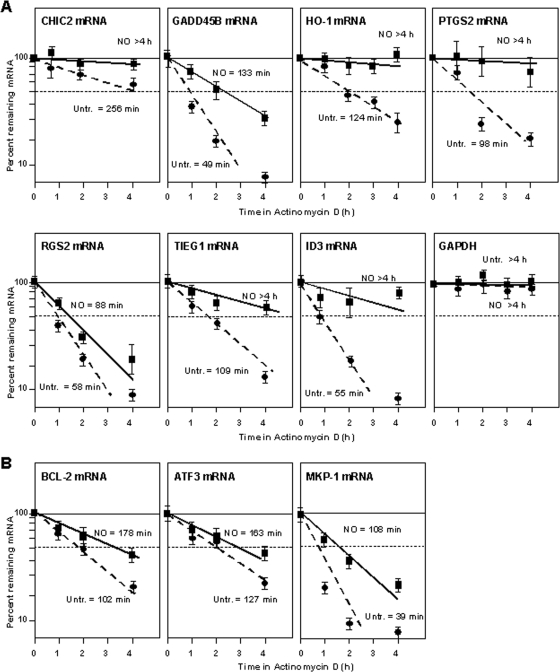
FIG. 3.
(A) Stabilities of the mRNAs shown in Fig. 2A. Following NO treatment (0.5 mM for 1 h), IMR-90 cells were incubated with Act D (2 μg/μl) for the times indicated. After RNA extraction and RT, the levels of the indicated mRNAs were measured by RT-qPCR, normalized to 18S rRNA values, and plotted as a function of the levels of that mRNA at time zero. The half-lives of each mRNA were calculated by regression analysis. The data reflect the means ± SD from three independent experiments. (B) mRNA stabilities were calculated as described for A for transcripts that were predicted to be specifically stabilized in IMR-90 cells.

