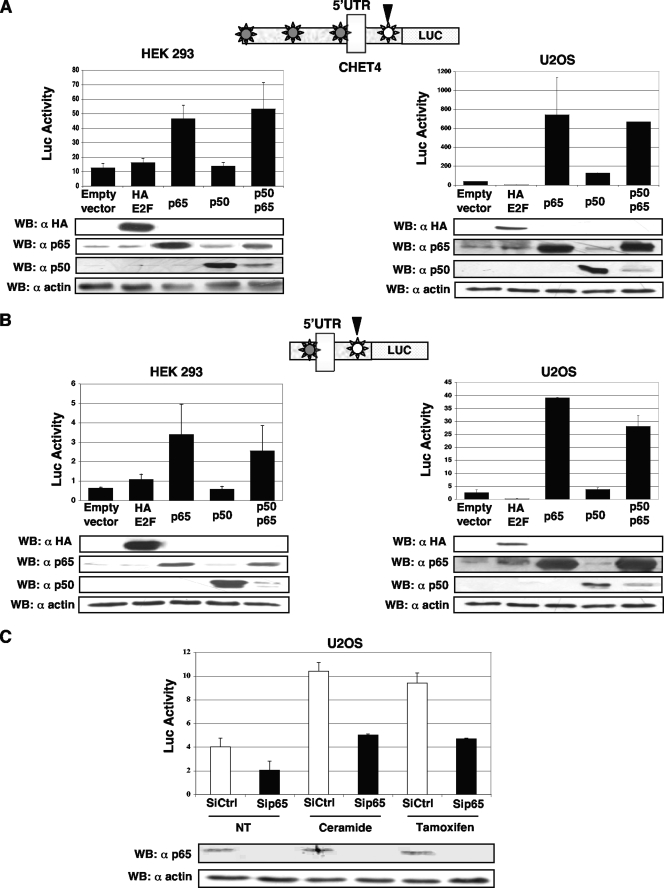
FIG. 2.
p65 regulation of the human BECN1 promoter. (A) At the top is a schematic representation of the CHET4 region of the human BECN1 promoter. Asterisks represent the κB sites predicted by TRANSFAC. The κB site predicted by CONFAC is in white. The pGL3 firefly luciferase (Luc) reporter containing 1.1 kbp of the human BECN1 promoter was cotransfected into HEK293T and U2OS cells together with a Renilla luciferase plasmid and E2F-, p65-, p50-, p65-, and p50-expressing plasmids or a control empty vector, respectively. Dual-luciferase assays were performed 24 h after transfection. Data represent the means of at least four independent experiments, and error bars represent standard deviations. A Student t test indicated a significant difference from the control (P < 0.05). (Bottom) The levels of each overexpressed protein was monitored by Western blot (WB) analyses. (B) At the top is a representation of the SCHET4 region of the human BECN1 promoter. Asterisks represent the κB sites predicted by TRANSFAC. The κB site predicted by both CONFAC and TRANSFAC is in white. For luciferase assays, HEK293T and U2OS cells were cotransfected with pGL3SCHET4/Renilla luciferase and E2F-, p65-, p50-, p65-, and p50-expressing plasmids or a control empty vector. Data represent the means of at least four independent experiments, and error bars represent standard deviations. A Student t test indicated a significant difference from the control (P < 0.05). (Bottom) The level of each overexpressed protein was monitored by Western blot analyses. (C) p65 expression was selectively knocked down by siRNA in U2OS cells. At 48 h later, cotransfection of pGL3SCHET4 and a Renilla luciferase control (Ctrl) plasmid was performed. At 16 h after transfection, the cells were treated with 25 μM ceramide or 10 μM tamoxifen or not treated (NT) and 5 h later, cell lysates were prepared for luciferase activity quantification. Data represent the means of at least three independent experiments, and error bars represent standard deviations. A Student t test indicated a significant difference from the control (P < 0.05). (Bottom) Immunoblotting was carried out with the same lysates to monitor the levels of endogenous p65. UTR, untranslated region.

