FIG. 5.
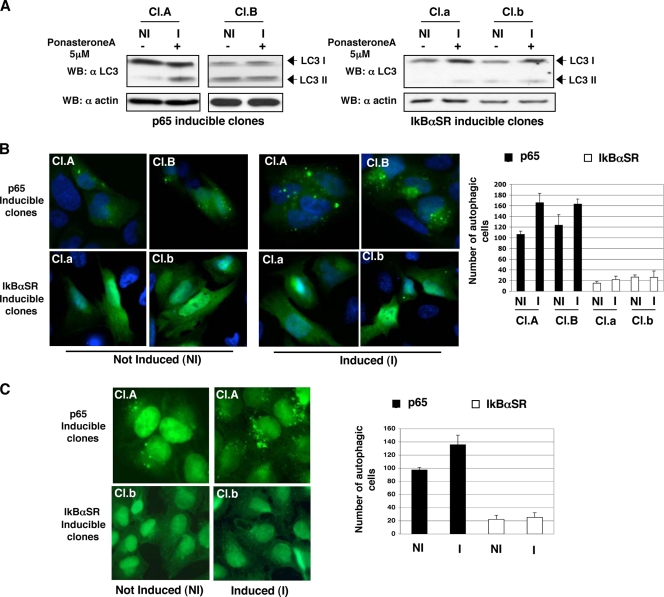
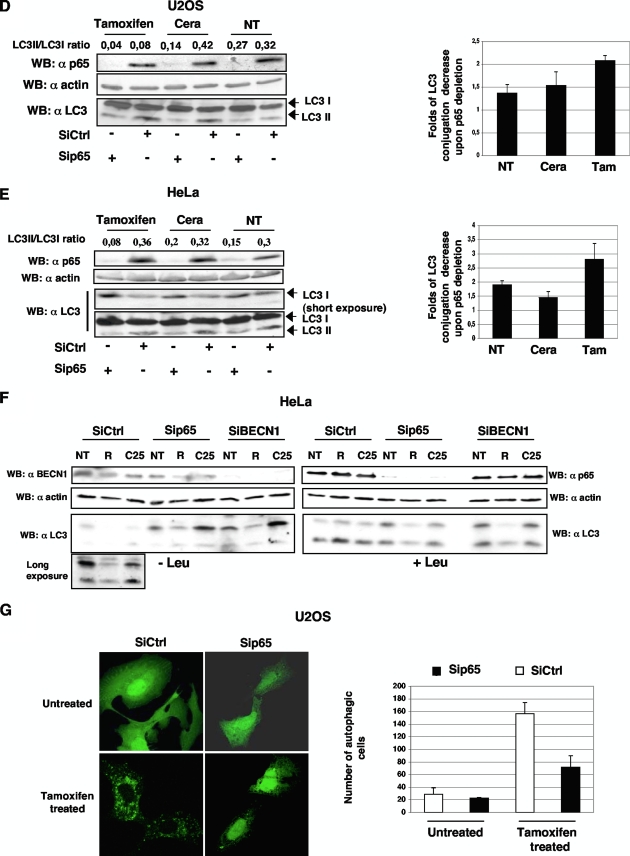
p65 regulation of autophagy. (A) Clones A and B, inducible for p65, and clones a and b, inducible for IκBαSR, were treated with 5 μM ponasterone A for 6 h. Processing of endogenous LC3 (LC3I to LC3II) in cell lysates was monitored by immunoblotting. (B, left side) U2OS derivative clones A and B, inducible for p65 expression, and clones a and b, inducible for IκBαSR expression, were transfected with a small amount (100 ng) of GFP-hLC3 for 6 h and then induced (I) with ponasterone A for 12 h or not induced (NI). GFP-hLC3 fluorescence was evaluated, and some representative images are shown. (B, right side) Two hundred cells were counted for each experiment, and the number of cells presenting punctate GFP-hLC3 staining is reported. Data represent the means of at least three independent experiments. (C, left side) U2OS-derivative clones A, inducible for p65 expression, and b, inducible for IκBαSR, were induced (I) with ponasterone A for 10 h or not induced (NI), and endogenous LC3 was immunostained. Some representative images are shown on the right. (C, right side) the number of autophagic cells is reported in the graph. In all cases, cells presenting more than five autophagosomes per cell were scored as autophagic. (D and E, left side) Depletion of p65 decreases endogenous LC3 processing. U2OS and HeLa cells were transfected with a p65-specific siRNA or a scrambled control (Ctrl) siRNA for 72 h and subsequently not treated (NT) or treated for 12 h with 25 μM ceramide (Cera) or 10 μM tamoxifen (Tam). Effect of p65 knockdown on LC3I-to-LC3II conversion was evaluated by immunoblotting. (D and E, right side) Quantification of LC3I and LC3II bands was performed with the ImageJ program, and the LC3II/LC3I ratios reported are representative of autophagic process activation. The bar graph shows the n-fold LC3 conjugation decrease that occurred upon p65 depletion. The values shown are the mean results of three independent experiments. (F) Depletion of p65 decreases endogenous LC3 processing. HeLa cells were transfected with a p65-specific siRNA, a BECN1 siRNA, or a scrambled control siRNA for 72 h and subsequently treated for 20 h with 25 μM ceramide (C25) or 100 μM resveratrol (R) in the presence or absence of 0.5 mM leupeptin. Effects of knockdown of both p65 and BECN1 on LC3 processing were evaluated by immunoblotting. (G) U2OS cells were transfected with a p65-specific siRNA or a scrambled control siRNA. At 72 h later, GFP-hLC3 was transfected, and 6 h later, the cells were either not treated or treated with 10 μM tamoxifen for other 12 h. Autofluorescence of GFP-hLC3 was evaluated; representative images are shown on the left. (Right side) Two hundred cells were counted for each experiment, and the number of cell presenting punctate GFP-hLC3 staining was determined. Data represent the means of at least three independent experiments. Cells presenting more than five autophagosomes per cell were scored as autophagic. p65 interacts with the BECN1 promoter and upregulates BECN1 protein expression in activated T cells. WB, Western blotting.


