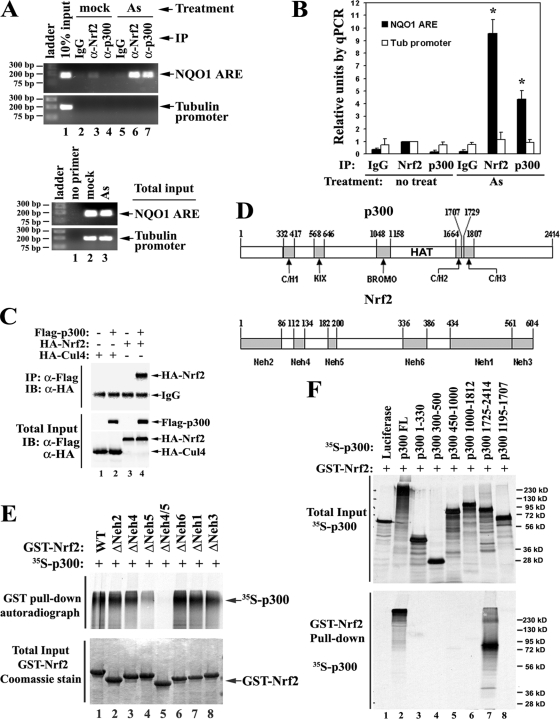
FIG. 2.
Nrf2 associates with p300. (A) Endogenous Nrf2 and p300 are coordinately recruited to the ARE in response to As(III)-induced stress. ChIP analysis was performed in HCT116 cells with the indicated antibodies after 4 h of treatment of 20 μM As(III). (Top) The genomic DNA fragments bound to either Nrf2 or p300 protein were recovered and quantified by qPCR using primer pairs specific for the NQO1-ARE region or the tubulin promoter region as a negative control. IP, immunoprecipitation. (Bottom) The total DNAs were amplified and visualized as described above to ensure equal input between mock and As treatment groups. (B) The precipitated DNA fragments in panel A were quantified by qPCR. The error bars indicate standard deviations. Asterisks indicate significant differences from IgG controls and the untreated group. IP, immunoprecipitation; Tub, tubulin. (C) Nrf2 interacts with p300 in vivo. HEK293T cells expressing Flag-tagged p300 and HA-tagged Nrf2 were lysed. The cell lysates were immunoprecipitated with anti-Flag (α-Flag) M2 matrix, followed by immunoblotting (IB) with anti-HA antibodies. An unrelated protein, Cul4, was included as a negative control. (D) Schematic of conserved domains in p300 and Nrf2 proteins. p300 contains five conserved domains: C/H1, KIX, BROMO, C/H2, and C/H3. The catalytic region, also known as the “HAT domain,” is between amino acids 1195 and 1673. Nrf2 contains six conserved domains: Neh2, Neh4, Neh5, Neh6, Neh1, and Neh3. (E) Nrf2 transactivation domains Neh4 and Neh5, especially Neh5, directly bind p300. (Top) p300 proteins were labeled with [35S]methionine and pulled down by GST-Nrf2 with different deletion mutants. The Nrf2-bound p300 was visualized by autoradiography. (Bottom) The same amounts of GST-Nrf2 proteins as used above were visualized by Coomassie blue staining. (F) The p300 C terminus directly interacts with Nrf2. (Top) Total inputs of different truncated forms of 35S-labeled p300 proteins were visualized by autoradiography. (Bottom) 35S-labeled p300 proteins were pulled down by GST-Nrf2 and visualized by autoradiography. Luciferase served as a negative control. FL, full length.

