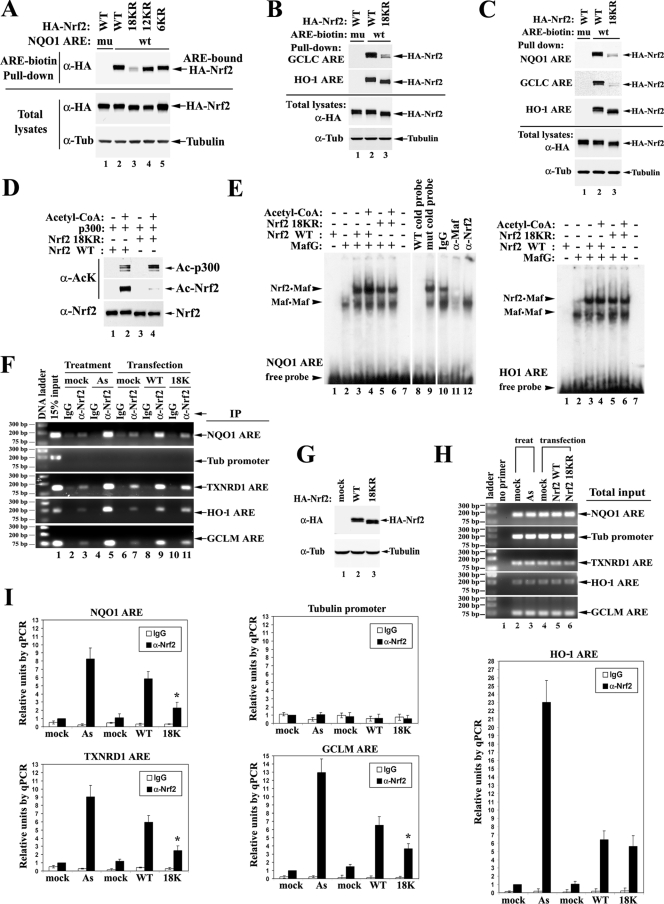
FIG. 7.
Acetylation augments promoter-specific DNA binding of Nrf2. (A) Nrf2 18KR has decreased binding affinity to NQO1 ARE compared to Nrf2 WT. HEK293T cells expressing the indicated HA-Nrf2 and p300 were lysed. The whole-cell lysates were incubated with either WT (wt) or mutated (mu) biotinylated ARE from the NQO1 promoter region. The protein-DNA-binding complexes were pulled down by streptavidin beads and analyzed by immunoblotting with anti-HA (α-HA) antibodies. Tub, tubulin. (B) Nrf2 18KR has decreased binding affinity to the GCLC ARE, but not to the HO-1 ARE, compared to Nrf2 WT. HEK293T cells expressing the indicated HA-Nrf2 and p300 were subjected to DNA-binding assays with the AREs from GCLC and HO-1 as described for panel A. Tub, tubulin. (C) The same DNA-binding assay was repeated in MDA-MB-231 cells. (D) Protein input for the mobility shift assay. Two hundred nanograms of purified GST-tagged Nrf2 WT or Nrf2 18KR protein was incubated with purified p300 protein in the absence or presence of acetyl-CoA in an in vitro 50-μl acetylation reaction; 1/10 of the reaction products were analyzed by immunoblotting with acetylation-specific antibody and Nrf2 antibody. Ac, acetylated. (E) A mobility shift assay was performed with 32P-labeled ARE probes in the presence of 2 μl of in vitro-translated MafG protein (Promega kit) and 4 μl of the indicated Nrf2 proteins from the in vitro acetylation reaction in panel D. (F) ChIP analysis was performed on HEK293T cells either treated with 20 μM As(III) or overexpressing the indicated HA-Nrf2 and p300. ChIP analysis was as described in the legend to Fig. 2A, with either IgG or anti-Nrf2 antibody. DNA fragments containing AREs of NQO1, TXNRD1, HO-1, and GCLM were amplified by PCR using specific primer sets and visualized on an agarose gel. The tubulin promoter region was also amplified to serve as a negative control. (G) Total cell lysates from HEK293T cells prepared in parallel with cells for the ChIP assay were subjected to immunoblot analysis with anti-HA antibodies. (H) Total DNA input was examined as for panel F. (I) The precipitated DNA fragments from the ChIP assay were quantified by qPCR. DNA precipitated by anti-Nrf2 antibodies in the mock-treatment group was set as 1. The error bars indicate the standard deviations from three experiments. The relative units of DNA amounts were plotted on the same scale for convenient comparison. The asterisks indicate significant differences from Nrf2 WT.

