FIG. 3.
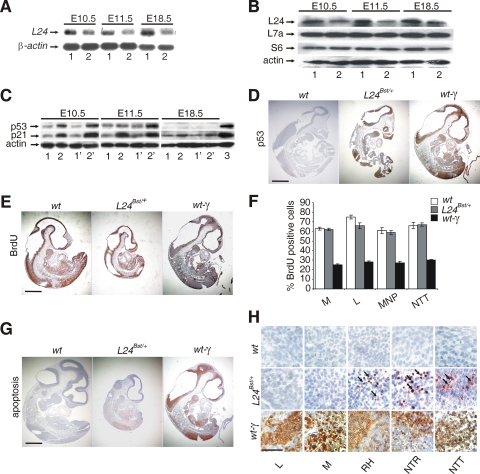
Accumulation of p53 and p21 proteins in Rpl24Bst/+ embryos during postgastrulation development. (A) Northern blot analysis of total RNA isolated from E10.5, E11.5, and E18.5 wt (lanes 1) and Rpl24Bst/+ (lanes 2) embryos using Rpl24 cDNA as a probe. RNA loading was normalized to the expression of β-actin mRNA. (B) The levels of Rpl24 protein in lysates of E10.5 and E11.5 wt (lanes 1) and Rpl24Bst/+ (lanes 2) embryos were determined by immunoblotting with anti-Rpl24 rabbit polyclonal antibody. Membranes were reprobed with antibodies to Rps6, Rpl7a, and actin. (C) Western blots showing the levels of p53 and p21 proteins in lysates from E10.5, E11.5, and E18.5 wt (lanes 1 and 1′) and Rpl24Bst/+ (lanes 2 and 2′) embryos. For each genotype, lysates of two littermates were analyzed. Reprobing with antibodies to actin served as a loading control. Lysates of E10.5, E11.5, and E18.5 samples were run on different gels but the membranes were immunoblotted at the same time. Actinomycin D-treated wt mouse embryonic fibroblasts served as a positive control for p53 and p21 antibodies (3). (D) Immunohistochemistry of sagittal sections of the entire E10.5 wt, Rpl24Bst/+, and gamma-irradiated wt embryos with anti-p53 antibody. (E) Sagittal sections of E10.5 embryos of the indicated genotypes were stained with anti-BrdU antibody. (F) Percentage of cells that were BrdU labeled in the liver (L), mandibula (M), medial nasal process (MNP) and neural tube in the tail (NTT) from E10.5 embryos of the indicated genotypes (n = 8 per each genotype). Error bars denote the SD. (G) Apoptosis in sagittal sections of the entire E10.5 wt, Rpl24Bst/+, and gamma-irradiated wt embryos. (H) Apoptosis in the liver (L), mandibula (M), roofs of hindbrain (RH), neural tube in the trunk (NTR), and neural tube in the tail (NTT) from embryos of the indicated genotypes (higher magnification of sections from panel G). Apoptotic cells were shown by arrows. wt embryos were gamma-irradiated (5 Gy) and analyzed 5 h thereafter in panels D to H. Scale bars: 500 μm (D, E, and G) and 100 μm (H).

