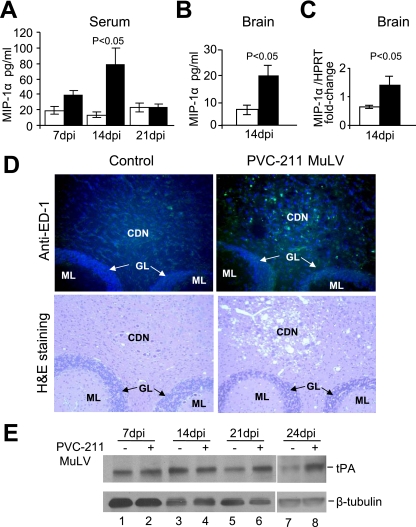
FIG. 4.
Increased levels of MIP-1α, activated microglia, and tPA in rats infected with PVC-211 MuLV. (A) MIP-1α levels were detected by ELISA in serum from PVC-211 MuLV-infected and control rats at 7, 14, and 21 dpi. (B) MIP-1α levels were detected by a standard sandwich ELISA in brain tissue (cerebellum and brain stem) from PVC-211 MuLV-infected and control rats at 14 dpi. (C) mRNA levels of MIP-1α were measured by real time PCR using brain tissue (cerebellum and brain stem) from PVC-211 MuLV-infected and control rats at 14 dpi. Three animals were used for each group and each experiment was repeated at least twice. □, control; ▪, PVC-211 MuLV; HPRT, hypoxanthine guanine phosphoribosyl transferase. Results of a representative experiment are shown. Data are means ± standard errors of the means. (D) (Top) ED-1 staining (green) of cerebellum from control or PVC-211 MuLV-infected rats at 21 dpi to detect activated microglia. Nuclei are counterstained with DAPI (blue). (Bottom) Similar sections stained with H&E to observe spongiform degeneration. Magnifications, ×20. CDN, cerebellum deep nuclei; GL, granular layer; ML, molecular layer. (E) Western blot analysis of the cerebellum of rats injected 7 to 24 days previously with PVC-211 MuLV or medium with antibodies against tPA or tubulin.

