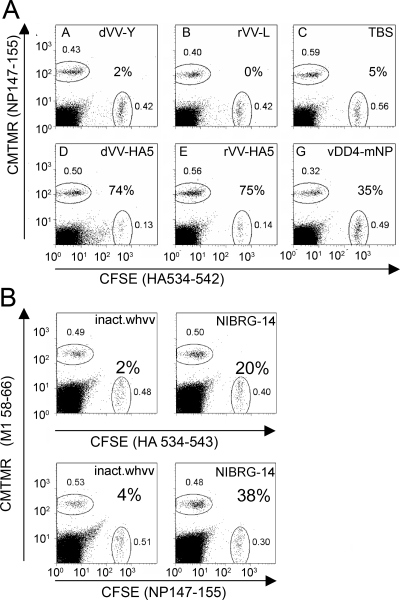
FIG. 6.
Flow cytometric analysis of killing of peptide-pulsed target cells by specific CD8 T cells. Peptide-loaded CMTMR+ and CSFE+ splenocytes are shown as a fraction of total lymphocytes in the culture (small numbers near region gates). Percent specific killing was calculated as 100 × (1 − [cells with specific peptide/cells with control peptide]). (A) Vaccinia virus vaccine groups. (B) Control vaccine groups. For abbreviations of experimental vaccines, see Table 1.

