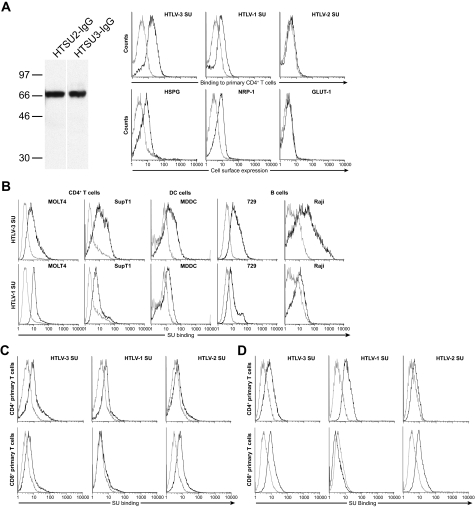
FIG. 2.
HTLV-3 SU binds to CD4+ and CD8+ T cells, dendritic cells, and B cells. (A) HTLV-3 SU binding to CD4+ T cells. (Left) HEK 293T/17 cells were transfected with either the plasmid encoding the HTLV-3 SU protein fused to rabbit IgG (HTSU3-IgG/pCMV-Env) or, as a control, a similar construct encoding the HTLV-2 SU fusion protein (HTSU2-IgG/pCMV-Env) (26). Cells were lysed, and Western blot analysis was performed as previously described (28) with the following modifications: the immunoblots were incubated overnight at 4°C with an antibody directed against HTLV SU (ZeptoMetrix). Numbers on the left indicate the positions of the molecular mass markers (in kDa). (Right) CD4+ T cells were isolated and activated for 24 h with phytohemagglutinin and IL-2. (Top) Cells were incubated with 200 ng of either the soluble form of HTLV-1 SU, HTLV-2 SU, HTLV-3 SU, or a similar fusion protein containing the SU protein from the avian retrovirus ALSV-A as a negative control. The amount of binding was determined by flow cytometry. In this and all subsequent SU binding studies: black line, HTLV SU; gray line, ALSV-A SU. (Bottom) Studies performed in parallel to determine the cell surface levels of components of the HTLV-1 receptor complex on the CD4+ T cells used in the SU binding studies. Cells were incubated with antibodies specific for HSPGs, NRP-1, or GLUT-1, and analysis was performed as described in Materials and Methods. Black line, binding of anti-HSPG antibody, anti-NRP-1 antibody, or anti-GLUT-1 antibody; gray line, isotype controls. (B) CD4+ T-cell lines (MOLT4, SupT1), dendritic cells (monocyte-derived dendritic cells [MDDC]), and B cell lines (729, Raji) were incubated with SU proteins, and the level of binding to SU was determined as described above. (Top) HTLV-3 SU binding. (Bottom) HTLV-1 SU binding. (C and D) CD4+ and CD8+ T cells were activated for either 2 days (C) or 4 days (D) and exposed to 100 ng of SU proteins, and the level of binding was determined. Flow cytometry results are representative of six (A, right), three (B and D) and four (C) independent experiments.

