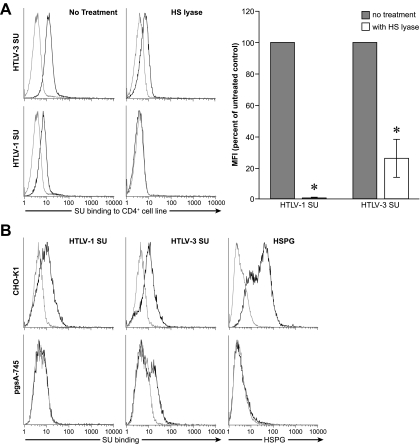
FIG. 3.
Contribution of HSPGs to HTLV-3 SU binding. (A) MOLT4 cells were incubated for 2 h in HS lyase buffer in the presence or absence of HS lyase, and the levels of binding to HTLV-1 SU and HTLV-3 SU were determined. Staining with anti-HSPG antibodies (not shown) was performed following the incubation to verify that the level of cell surface HSPGs was reduced to below the level of detection. (Left) Histogram of one representative experiment. (Right) Graph representing an average of three independent experiments. Mean fluorescent intensity (MFI) was determined by subtracting the MFI of the negative control (ASLV-A SU) from the MFI of the HTLV SU. MFI obtained in the absence of HS lyase was normalized to 100%, and the average value from three independent experiments was determined; error bars denote SEM. Statistical significance was determined by analysis of variance followed by Tukey's test. An asterisk denotes significant differences from controls (binding in the absence of HS lyase). The P values were as follows: no treatment with HTLV-1 SU versus HS lyase treatment, <0.001; no treatment with HTLV-3 SU versus HS lyase treatment, <0.001. (B) CHO-K1 and HSPG-negative CHO-K1 mutant (CHO-K1-pgsA-745) cells were incubated with HTLV-1 and HTLV-3 SU, and the levels of SU binding (left) and anti-HSPG antibody staining (right) were determined. The MFIs for the SU binding were as follows: CHO-K1/SU-1, 2.2; pgsA-745/SU-1, 0.0; CHOK1/SU-3, 4.5; pgsA-745/SU-3, 2.6. For the left two panels: black line, HTLV SU; gray line, ALSV-A SU. For the right panel: black line, binding of anti-HSPG antibody; gray line, isotype control.

