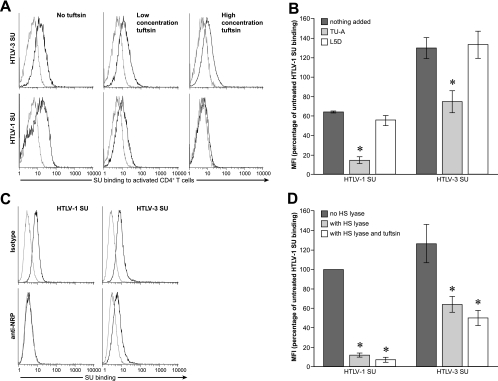
FIG. 4.
Contribution of NRP-1 to HTLV-3 SU binding. (A and B) Primary activated CD4+ T cells were incubated with peptides homologous to an NRP-1-binding domain of the NRP-1 ligand VEGF165, and the levels of HTLV-1 and HTLV-3 SU binding were determined. (A) Cells were incubated with either 5 μg/ml (low concentration TU), 50 μg/ml of the 4-mer peptide TU (TKPR) (high concentration TU), or left untreated (no TU). The MFIs for the SU binding were as follows: no TU/SU-1, 5.2; 5 μg/ml TU/SU-1, 4.0; 50 μg/ml TU/SU-1, 0.7; no TU/SU-3, 8.3; 5 μg/ml TU/SU-3, 7.5; 50 μg/ml TU/SU-3, 4.9. (B) Cells were incubated with 50 μg/ml of either the 5-mer peptide TU-A (TKPPR) or a 5-mer control peptide (L5D; LTRKD) or left untreated. The MFIs for SU binding were determined and normalized to the MFI of HTLV-1 SU binding in the absence of peptides (100%), and the average value from three independent experiments was determined. Statistical significance was determined as above; an asterisk denotes significant differences from controls. P values were as follows: HTLV-1 SU with no peptide versus TU-A, <0.05; HTLV-1 SU with no peptide versus L5D, >0.05; HTLV-3 SU with no peptide versus TU-A, <0.01; HTLV-3 SU with no peptide versus L5D, >0.05. (C) The CD4+ T-cell line SupT1 was incubated for 1 h with 10 μg/ml of either an antibody directed against an extracellular portion of NRP-1 or an isotype control (mouse IgG1) and then exposed to the SU proteins. The MFIs for the SU binding were as follows: isotype/SU-1, 3.5; anti-NRP-1/SU-1, 0.2 (5.7% of isotype); isotype/SU-3, 5.5; anti-NRP-1/SU-3, 2.69 (48.5% of isotype). (D) CHO-K1 cells were treated with HS lyase, and binding assays were performed as in panel A, except that a portion of the cells treated with HS lyase were also incubated with 20 μg/ml TU. Shown is the MFI for SU binding from three independent experiments, normalized as described above. An asterisk denotes significant differences from binding of the same SU to untreated cells. P values were as follows: no treatment with HTLV-1 SU versus HS lyase treatment, <0.001; no treatment with HTLV-1 SU versus HS lyase and TU treatment, <0.001; no treatment with HTLV-3 SU versus HS lyase treatment, <0.01; no treatment with HTLV-3 SU versus HS lyase and TU treatment, <0.001. HTLV-3 SU bound at significant levels to cells that had been enzymatically treated to remove HSPGs (light gray bar). HTLV-3 SU also bound to cells when NRP-1 interactions were blocked and HSPGs were removed (white bar).

