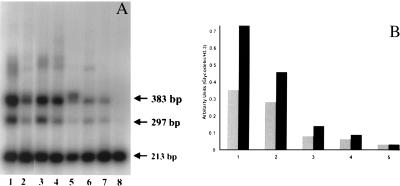
Figure 7.
(A) RT-PCR for glycodelin transcripts in early pregnant (lanes 1 and 2), hCG-treated (lanes 3 and 4), and heat-inactivated hCG-treated (lanes 5 and 6) cycling baboons (A). Lanes 7 and 8 represent ovariectomized baboons treated with hCG or heat- inactivated hCG, respectively. Note that two major transcripts (383 and 279 bp) are amplified during pregnancy and after hCG infusion. The 213-bp transcript is the histone 3.3 internal standard that was coamplified with the glycodelin primers. (B) The bar graphs represent the mean values of the densitometric scans of each transcript shown in A and expressed as a ratio to histone 3.3. Note that in response to CG either in pregnancy (bars 1) or with hCG infusion (bars 2) the higher molecular weight transcript (383 bp; black bars) predominates. The response after ovariectomy is attenuated, but the higher molecular weight form is evident in animals treated with bioactive hCG (lane 7 in A and 4 in B). The gray bars represent the low molecular weight (279 bp) transcript.

