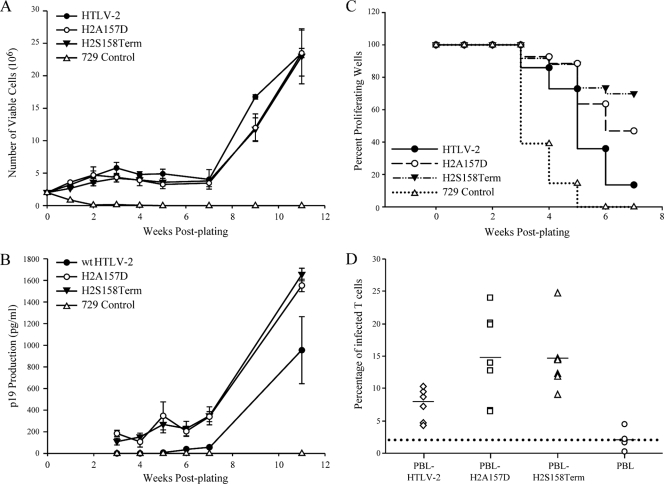
FIG. 5.
HTLV-2 T-lymphocyte immortalization and proliferation assays. PBMCs (2 × 10⁶) were cultured with irradiated donor cells (1 × 10⁶) in each well of 24-well plates. (A) Representative growth curves for HTLV-2-infected cells are shown. Cell viability was determined weekly by trypan blue exclusion (0 to 11 weeks postcocultivation). The mean and standard deviation for each time point were determined from three independent wells. (B) HTLV-2 gene expression was confirmed by detection of p19 Gag protein in the culture supernatant using ELISA. (C) Representative Kaplan-Meier plots for T-lymphocyte proliferation in a short-term microtiter assay. Prestimulated PBMCs (104) were cocultured with 100 irradiated 729 stable producer cells per well in 96-well plates. The Kaplan-Meier plot shows the percentage of proliferating wells as a function of time (weeks). (D) Functionally more active Rex enhances viral infectivity in coculture assays. Irradiated 729 stable producer cells (2 × 10⁵) were cocultured with 106 PBMCs in the presence of IL-2. The percentages of newly infected T cells (CD3+, p19+) were enumerated 2 days postplating by using immunofluorescence analysis. The mean and standard deviation for each sample were determined from three independent experiments using PBMCs from three different healthy donors. The mean values are indicated by the horizontal lines. The percentages of Rex H2A157D mutant- and H2S158Term mutant-infected T cells are both significantly higher than that of wt HTLV-2-infected T cells (P < 0.001) as determined by using analysis of variance (ANOVA) followed by Tukey's posttest.

