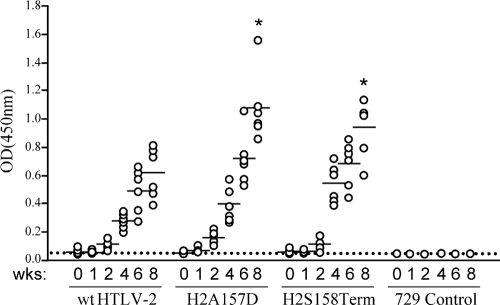
FIG. 6.
Assessment of HTLV-2 infection in inoculated rabbits. Antibody responses against HTLV-2 from each rabbit were measured by an anti-HTLV-2 ELISA, using both HTLV-2 Gag and envelope proteins as antigens. Each dot represents the absorbance value of a single inoculated rabbit at 0, 1, 2, 4, 6, and 8 weeks postinoculation within each group. The inocula as indicated below include 729wtHTLV-2 (n = 6), 729H2A157D (n = 6), 729H2S158Term (n = 6), or 729 (n = 2). The horizontal line represents the average of the rabbit group at each weekly time point. Statistical analysis (ANOVA followed by Tukey's posttest) of titers at 4 and 8 weeks after inoculation revealed significantly higher antibody responses to HTLV-2 antigens in the 729H2A157D-inoculated (P < 0.01) and 729H2S158Term-inoculated (P < 0.05) rabbits (denoted by an asterisk) than in the wt control group. Week 6 displayed borderline significance (P = 0.058). OD(450nm), optical density at 450 nm.

