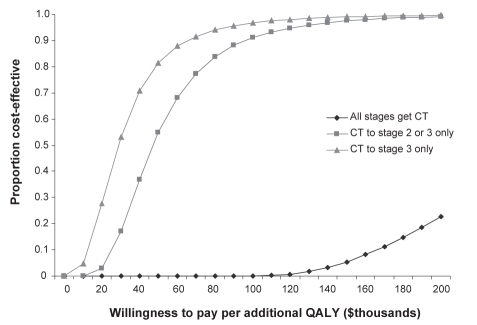
Figure 1).
Acceptability curve for a three-year model, constructed from 100,000 sample sets generated from a Monte Carlo simulation. Using long-acting beta2-agonist (LABA) monotherapy as the comparator, the curve depicts the proportion of incremental cost-effectiveness ratio from strategies using combination therapy (CT) that were below a range of cost per quality-adjusted life year (QALY) thresholds. Therefore, the curve represents the probability that CT is cost-effective (compared with LABA monotherapy) at particular cost per QALY thresholds

