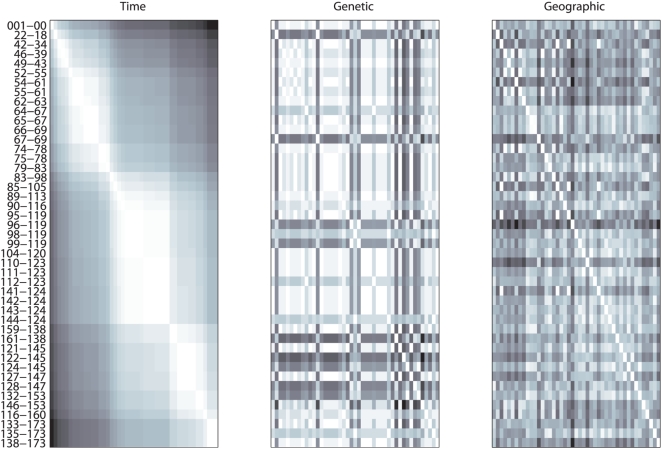
Figure 4. Symmetrical matrices.
Symmetrical matrices representing: A) temporal, B) genetic and C) spatial distances among the 46 samples. For easy visual comparison, numbers were substituted by a scale of colours that ranges from white (lower value) to black (higher value). The samples were organized temporally as indicated by the gradual pattern observed in matrix A), and the colours of the names of the samples are meant to facilitate the comparison with the results.

