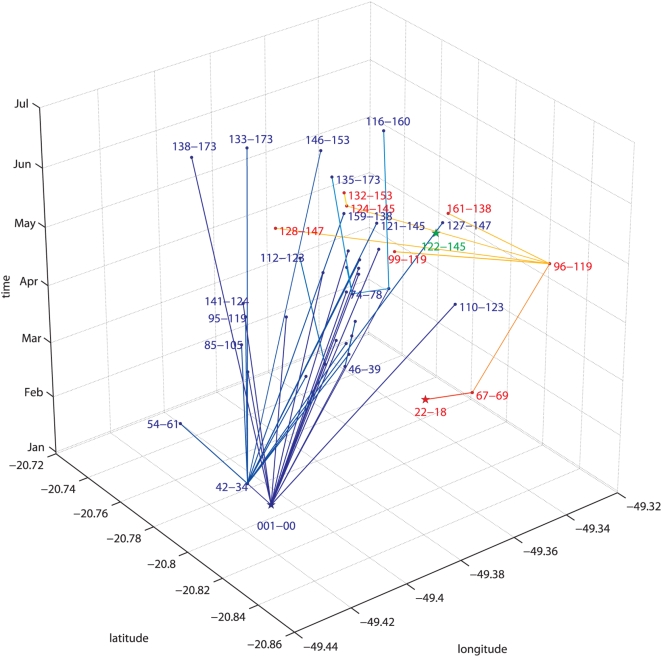
Figure 5. Estimated routes of dispersion of dengue as obtained by the “Nepotistic algorithm”.
The basis of the three dimensional graphic represents the geographic coordinates of the positions where the sample were collected, while the vertical axis represents the months of the sampling. Each independent lineage starts with a “star” (oldest sample of the lineage) and the connections to the other samples (names are displayed as close to point as possible) are done with lines, whose width is proportional to the genetic relatedness between the samples. The three lineages represented are: (i) green the more recent, with only one sample, the 122-145, (ii) red or “South-eastern” lineage (starting with 22-18, that turns to yellow with more recent “ancestry” samples) and (iii) blue, or North-western” lineage 1 (starting at 01-00, and that gets lighter as for the previous one).

