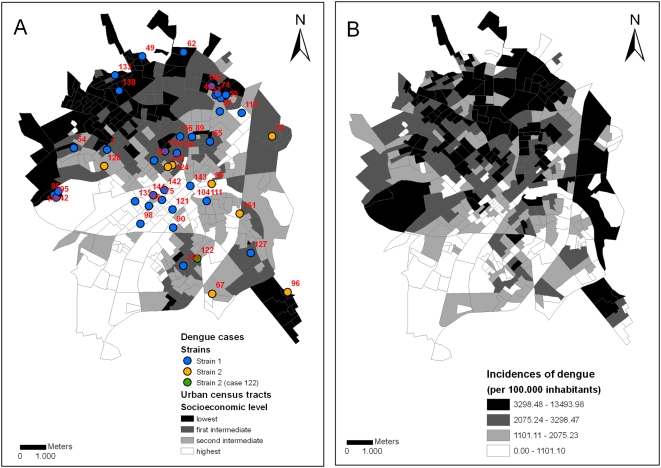
Figure 9. Urban census tracts.
Urban census tracts (i.e., continuous and homogeneous areas comprising 300 buildings on average, IBGE 2002) according to socioeconomic levels (quartile) and dengue cases with molecular analysis according to strains from January 2006 to June 2006 (A); urban census tracts according to incidence coefficients of dengue cases (quartile) reported to the Surveillance System from September 2005 to August 2006 (B).

