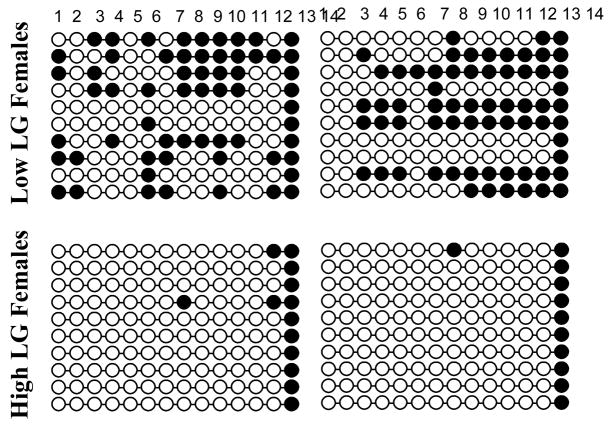
Figure 1.
Bead-on-string illustration of methylation patterns within the 1b promotor region of ERα in MPOA tissue from offspring of High (n=2) and Low LG (n=2) dams. Black circles indicate the presence of 5-methylcytosine. The columns represent the 14 potential sites of differential methylation within the promotor sequence.

