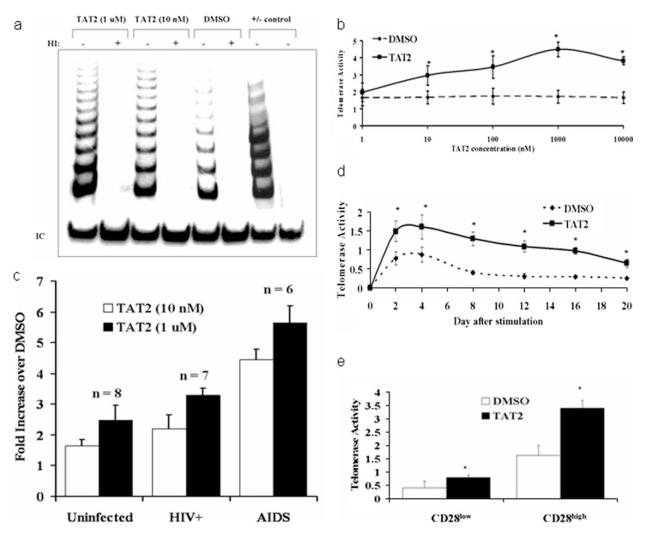
FIGURE 1.
Telomerase activity in PBMC and T lymphocytes treated with TAT2. a, An 8% acrylamide gel showing TRAP products from PHA (12 μg/ml)-stimulated PBMC of an HIV+ donor. Cells were treated with TAT2 (1 μM) or DMSO (0.1%) every 48 h for 12 days, at which point cells were harvested for TRAP assay. Each lane shows and equivalent of 1 × 10⁴ cells. HI, Heat inactivation; IC, internal control. b, Dose-response curve of PHA-stimulated PBMC from HIV-infected individuals (n = 6), showing mean (and SD) telomerase activity from cultures treated with TAT2 vs DMSO every 48 h for 12 days. c, Fold-increase over DMSO control of telomerase activity from PHA-stimulated PBMC treated with TAT2 (1 μM) for 7–12 days. Error bars indicate SD. d, Kinetics of telomerase activation of T lymphocytes stimulated with CD2/CD3/CD28 Ab-coated beads. Cells were treated with TAT2 (1 μM) or DMSO (0.1%) at multiple time points after stimulation (days 1, 3, 7, 11, 15, and 19) and harvested for TRAP assay 24 h after treatment. Each symbol represents a time point at which telomerase activity was evaluated (n = 3). e, Telomerase activity of separated CD28high and CD28low CD8+ T cells after treatment with TAT2 or DMSO (n = 6). CD8+ T cells were isolated, stimulated with CD2/CD3/CD28 Ab-coated beads, and treated with TAT2 or DMSO every 48 h. After 12 days, CD28high and CD28low cells were isolated from the treated CD8+ population by incubation with anti-CD28-magnetic microbeads and passage through a magnetic separation column, then tested for telomerase activity. Error bars indicate SD. * indicates p value <0.05.

