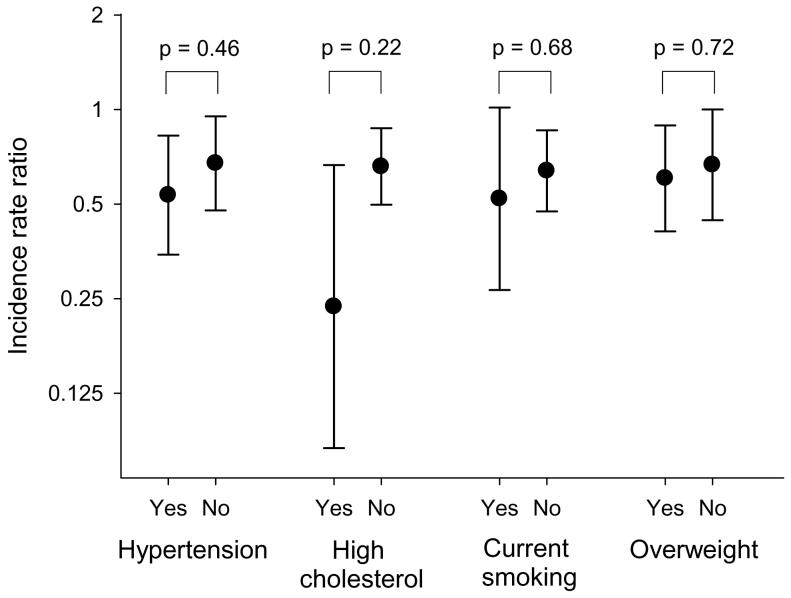
Figure 2.
The circles represent the incidence rate ratios of heart failure comparing the top to bottom quartiles of the DASH component score, and lines represent 95% confidence intervals. P-values are for tests of the difference in estimates between those with and without self-reported hypertension, self-reported high cholesterol, current cigarette smoking, and body mass index ≥ 25 kg/m2. Cox proportional hazards models with baseline hazard allowed to vary by age and additionally adjusted for physical activity (linear), energy intake (linear), education (less than high school, high school, university), family history of myocardial infarction at less than 60 years (yes, no), cigarette smoking (current, past, never), living alone (yes, no), postmenopausal hormone use (yes, no), self-reported history of hypertension and high cholesterol, body mass index (linear), and incident myocardial infarction (time varying: no myocardial infarction, myocardial infarction in the previous year, more distant history of myocardial infarction).

