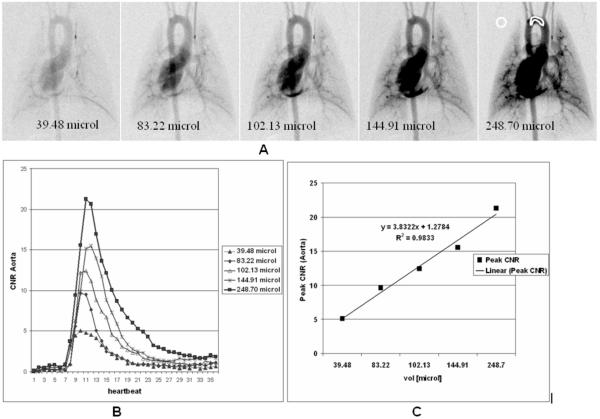
Fig.3.
Micro-DSA images corresponding to maximum peak enhancement in the aortic arch at 5 different injections volumes (A). ROIs were selected in the aorta and the background and the CNR Aorta is plotted for the different injections (B). The linearity of the imaging system is confirmed by the plot of the CNR versus injection volume for the 5 injections (C).

