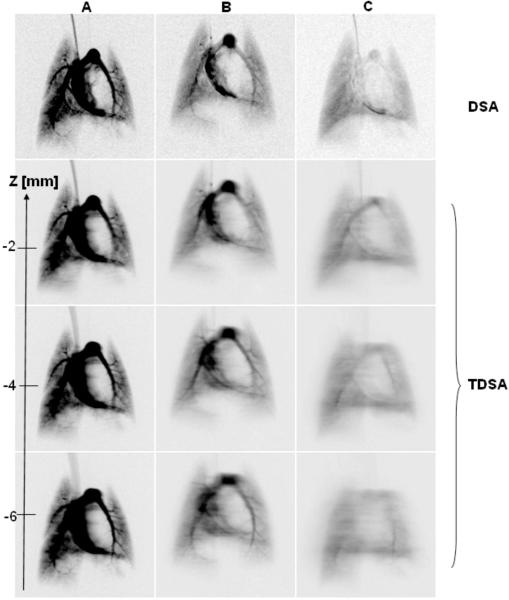
Fig.5.
Comparison for the fourth heartbeat post injection between DSA images and three TDSA tomographic planes obtained with: A) 20° and 11 injections of 144.91μL each, B) 40° and 21 injections of 83.22 μL each and C) 80° arc and 41 injections of 39.48 μL. The first row shows the corresponding DSA images for a single injection of : 144.91μL (DSA A), 83.22μL (DSA B) and 39.48μL ( DSA C).

