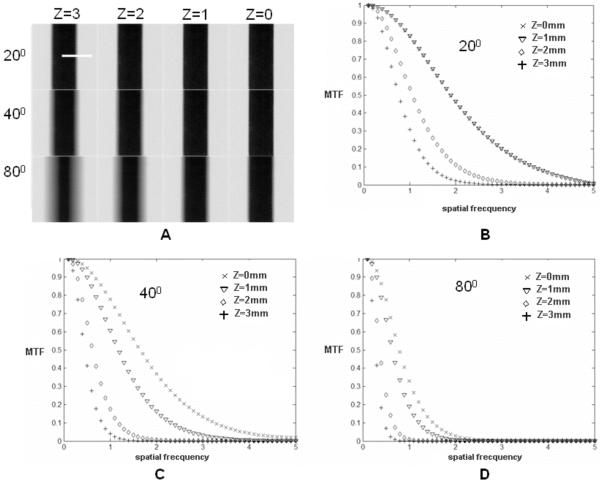
Fig.6.
A) Four (x-y) TDSA planes at Δz=1mm interval for the thin plate phantom positioned at z=0. The 4 TDSA images were obtained with projections acquired over three reconstruction arcs (20°, 40° and 80°) and the same angular step of 2°. The MTF plots based on the edge profile (see dotted line in A) characterize the filtration along the (x-z) plane for the three arcs 20° (B), 40°(C), 80° (D).

