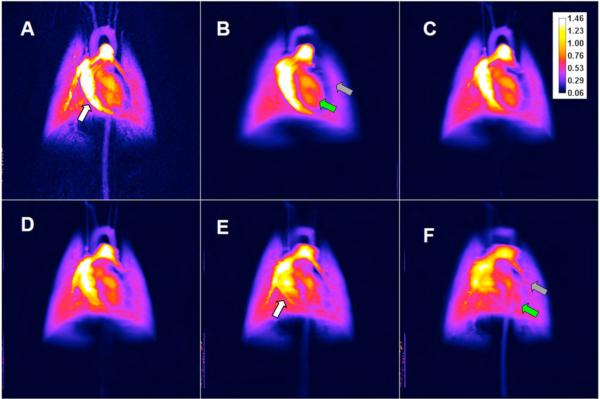
Fig.8.
A comparison between perfusion maps for DSA (A) and TDSA at z=(4, 0,-2,-4,-6) mm (B,C,D,E,F). The white arrows show the pulmonary vessel for which perfusion can be estimated in a TDSA slice (E) but not in DSA (A). Note also how various TDSA planes are different e.g. the LV pointed by the green arrow in (B) does not appear in (F) while the pulmonary artery in (F), shown by the gray arrow, is not in present in (B).

