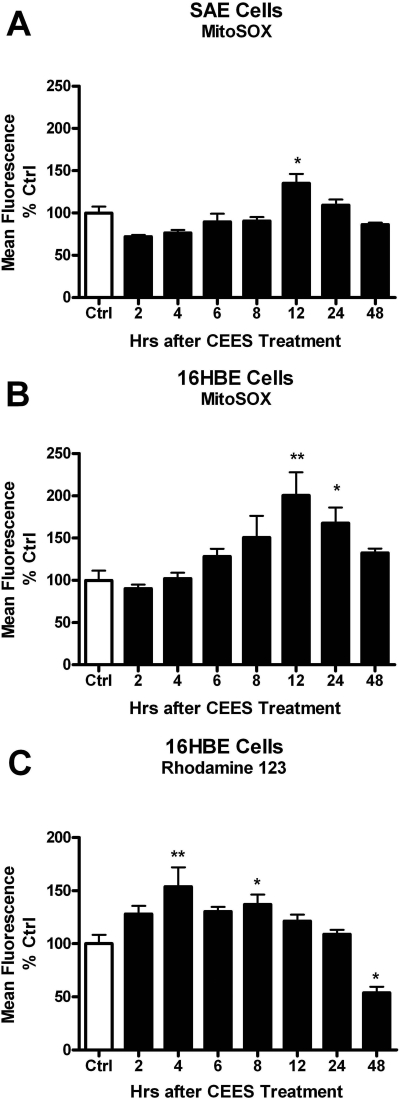
Fig. 3.
CEES exposure produces increased levels of mitochondrial ROS and dysfunction. SAE (A) and 16HBE (B) cells were treated with 900 μM CEES for 2, 4, 6, 8, 12, 24, and 48 h, after which cells were incubated with the mitochondrial ROS probe MitoSOX (A and B) for 1 h or mitochondrial membrane potential indicator Rhodamine 123 (C) for 30 min. Cells were washed then scraped and placed in microtiter tubes. Fluorescence was determined via flow cytometry gated on the live cell population. MitoSOX fluorescence correlated with increased ROS, whereas Rhodamine 123 fluorescence is inversely correlated with mitochondrial membrane potential. Data are expressed as percentage of the control, where the control fluorescence was set to 100%. *, p < 0.05; **, p < 0.01 compared with control group; n = 3.

