Fig. 7.
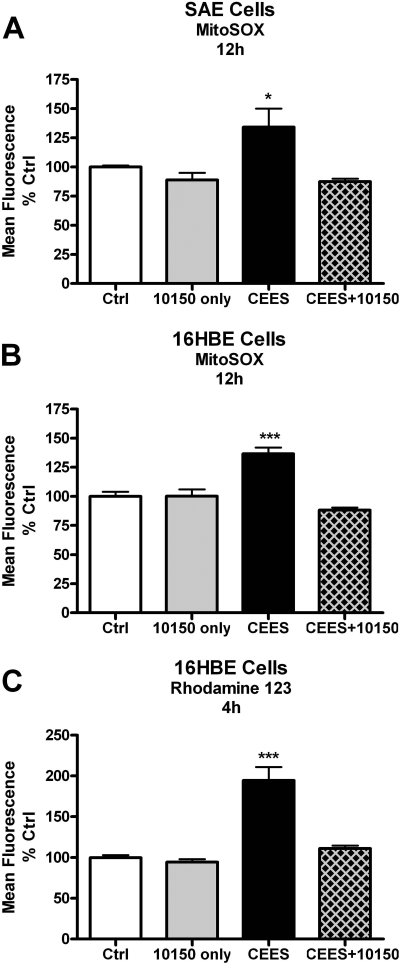
AEOL 10150 rescues CEES-induced increases in mitochondrial ROS and dysfunction. SAE (A) and 16HBE (B) cells were exposed to 900 μM CEES for 12 h. AEOL 10150 (50 μM) was added 1 h after CEES exposure, and ROS was determined using MitoSOX with flow cytometry. C, 16HBE Cells were exposed similar as before except for 4 h. Mitochondrial membrane potential was determined using Rhodamine 123, where fluorescence is inversely correlated with mitochondrial membrane potential. Mean fluorescence was normalized to control levels with controls being 100%. Data represents mean ± S.E.M., n = 3 to 6; *, p < 0.05; ***, p < 0.001 compared with control values. Two-way ANOVA of AEOL 10150, p = 0.0563; CEES, p = 0.0033; interaction, p = 0.042 (A); AEOL 10150, p = 0.1073; CEES, p = 0.0004; interaction, p < 0.0001 (B); and AEOL 10150, p = 0.2876; CEES, p = 0.0007; interaction, p = 0.0051 (C).

