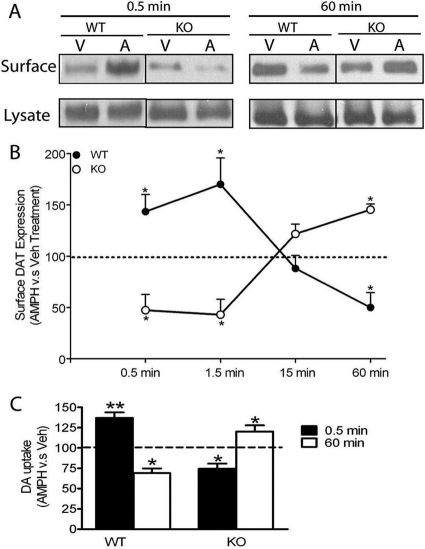
Fig. 3.
Differential time-dependent DAT trafficking and DAT activity upon short- or long-term AMPH treatment between WT and KO mice. A, representative blots of surface (biotinylated fraction) and total DAT expression upon short- and long-term A (10 μM) or V treatment for WT and KO mice. B, surface DAT level was expressed as the ratio of biotinylated DAT versus the total DAT. The data shown in B were calculated as the percentage of surface DAT level upon the AMPH treatment (biotinylated DAT/lysate DAT) relative to the Veh treatment for WT and KO mice and graphically demonstrated as a time course. A two-way ANOVA (time × genotype) revealed a significant interaction effect of genotype and time [F(3,42) = 10.90, p < 0.01]. Upon short-term AMPH exposure (0.5 and 1.5 min), there was a significant increase in surface DAT expression in striatal synaptosomes for WT mice (n = 8) and a significant decrease for KO mice (n = 5) compared with their control (Veh-treated) groups (AMPH versus Veh, paired Student's t test; *, p < 0.05). Upon long-term AMPH exposure (60 min), there was a significant decrease in surface DAT expression for WT mice (n = 5) and a significant increase for KO mice (n = 3) (AMPH versus Veh, paired Student's t test; *, p < 0.05). C, striatal synaptosomes were pretreated with AMPH or Veh for 0.5 or 60 min. Then, synaptosomes were washed extensively to remove residual AMPH before measurement of [3H]DA uptake. Data were expressed as the percentage of the [3H]DA uptake into synaptosomes pretreated with AMPH relative to Veh. Upon short-term AMPH exposure (0.5 min), there was a significant increase in [3H]DA uptake into synaptosomes from WT mice compared with their Veh-treated control groups (paired Student's t test, p < 0.01, n = 4) and a significant decrease for KO mice (paired Student's t test, p < 0.05, n = 4). Upon long-term AMPH exposure (60 min), there was a significant decrease in [3H]DA uptake into synaptosomes from WT mice (n = 6) and a significant increase for KO mice (n = 5) compared with control synaptosomes. *, p < 0.05; **, p < 0.01. Data are represented as mean ± S.E.M.

