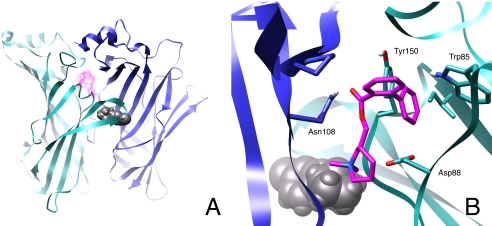
Fig. 10.
Docking of COB-3 to a computational model of the α3β4 nAChR. A, position of the most frequent COB-3 (pink) docking cluster on the rat α3β4 nAChR LBD model. The docking position is at the α/β interface on the pore-side of the channel. Three of the five subunits are not shown for clarity. B, detailed interactions of COB-3 at the α/β interface as viewed from inside the pore. The α3 subunit is shown in cyan and the β4 subunit is in blue. Epibatidine is shown in gray at the agonist binding site.

