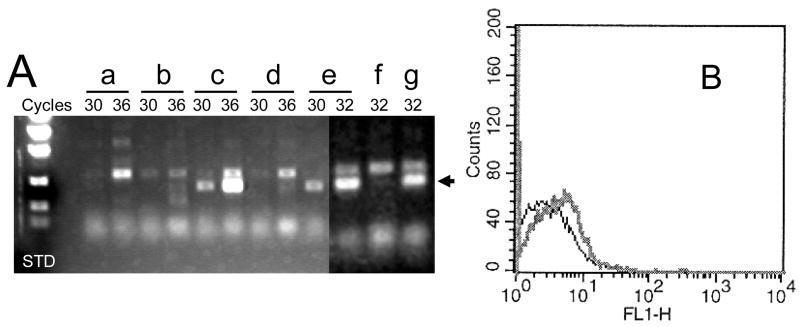
FIGURE 10.
Expression of ITGA1 mRNA in CHRF288-11 cells after the treatment with 5-aza-deoxyCytidine (5-AZA) or Trichostatin A (TSA). (A) The cDNA product amplified by RT-PCR after 30, 32 or 36 cycles is depicted for cells were (a) untreated or treated with (b) 0.01 % (v/v) DMSO for 24 hrs; (c) 5μM 5-AZA for 24 hrs; (d) DMSO for 48 hrs; (e) 5-AZA for 48 hrs; (e) TSA for 48 hrs; or (f) 5-AZA plus TSA for 48 hrs. The arrow in the right hand margin denotes the position of the expected ITGA1 cDNA product. (B) The surface expression of integrin α1 at 48 hours after treatment with 5-AZA (gray curve) is shifted to the right relative to that obtained for cells treated with DMSO (black curve), as measured by flow cytometry using monoclonal anti-α 1 antibody.

