
Figure 5.
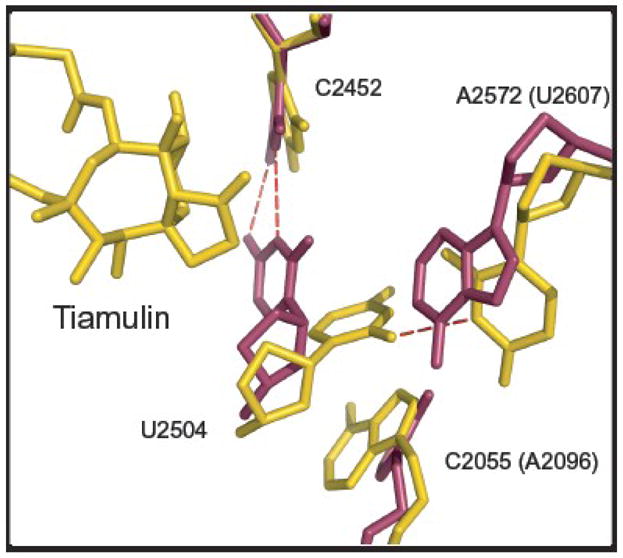
Interactions that control the conformation of U2504(2539) in H. ma and E. coli. The H. ma structure shown is the tiamulin-ribosome complex structure described here, and the E. coli structure is PDB# 2AW439. The two have been superimposed using phosphorus atom positions in the PTC. Tiamulin and the H. ma ribosome are shown in gold and the E. coli ribosome is in magenta.