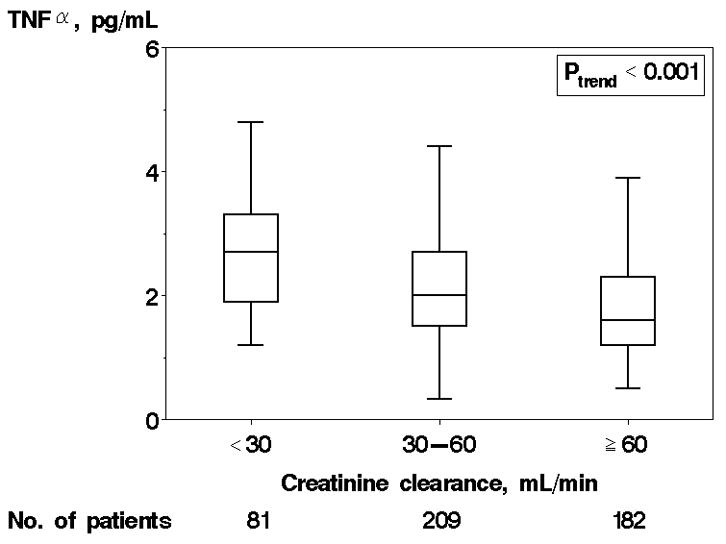
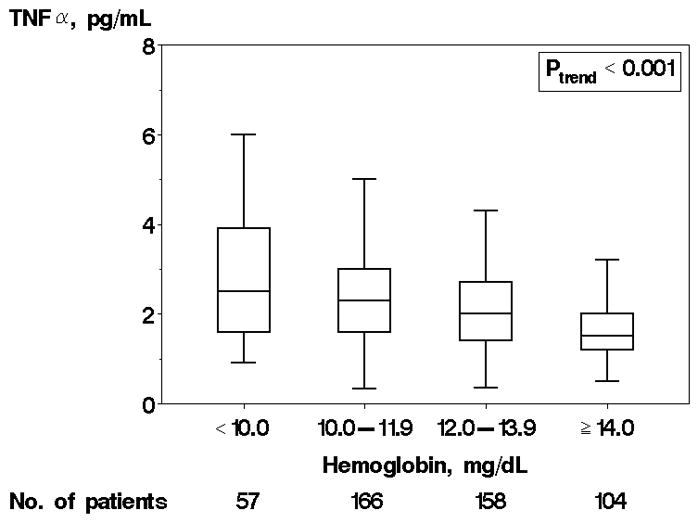
Figure 1.


Tumor Necrosis Factor α (TNFα) levels by Creatinine Clearance and Hemoglobin. Caption: TNFα levels by creatinine clearance (A) and hemoglobin (B) are shown. Each box displays the median, 25th percentile, and 75th percentile values; horizontal bars represent 1.5 times the interquartile range.
No.= number
