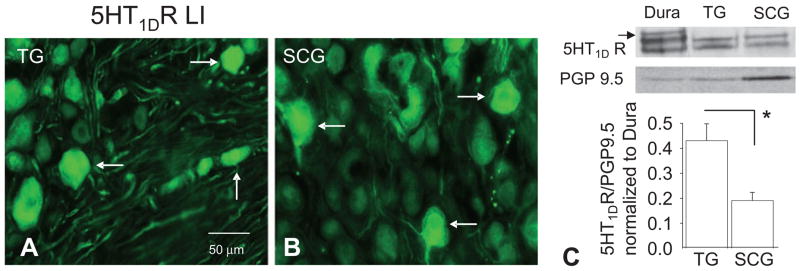
Figure 6.
5HT1DR LI (arrows) was present in subpopulations of neurons in trigeminal ganglia (TG) (A) and superior cervical ganglion (SCG) (B). (C) Top panel: Western blot analysis of 5HT1DR LI in TG and SCG protein: blot is from tissue obtained from a single rat. The high-molecular-weight band present in the dura (arrow) was present in neither TG nor SCG. Bottom panel: Pooled data (n = 5) indicate that relative levels of 5HT1DR are greater in TG than in SCG. *P ≤ 0.05.

