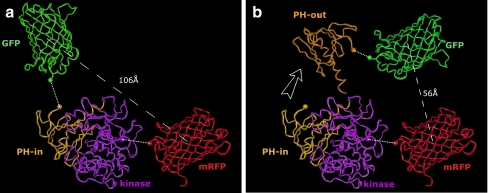
Fig. 2.
Model for GFP and mRFP change in distance upon GFP-PKB-mRFP change in conformation. a The kinase domain of PKB is shown in purple ribbons with GFP and mRFP, respectively, in green and red ribbons. In gold, PKB PH domain is shown in its “PH-in” conformation. The white dashed lines represent the linkages between the PKB domains and GFP or mRFP. b When the PH domain moves to its “PH-out” conformation (orange), GFP moves to a new location. During this movement, the distance between GFP and mRFP becomes smaller (distances shown in white lines are taken between the centres of domains or proteins)

