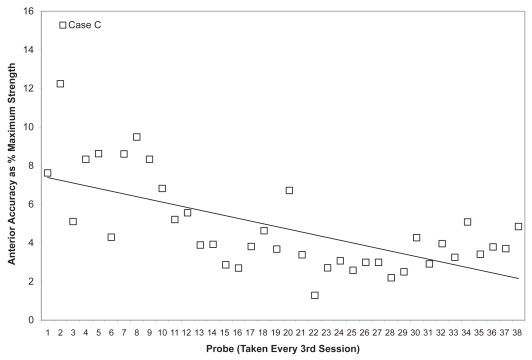
Figure 13.
Mean anterior tongue pressure accuracy (ie, distance from a specified target, measured in kilopascals), is shown as a percentage of the maximum isometric anterior tongue pressure measured (in kilopascals) in the corresponding treatment session for Case C. The linear trend line shows the pattern of change across the course of treatment.

