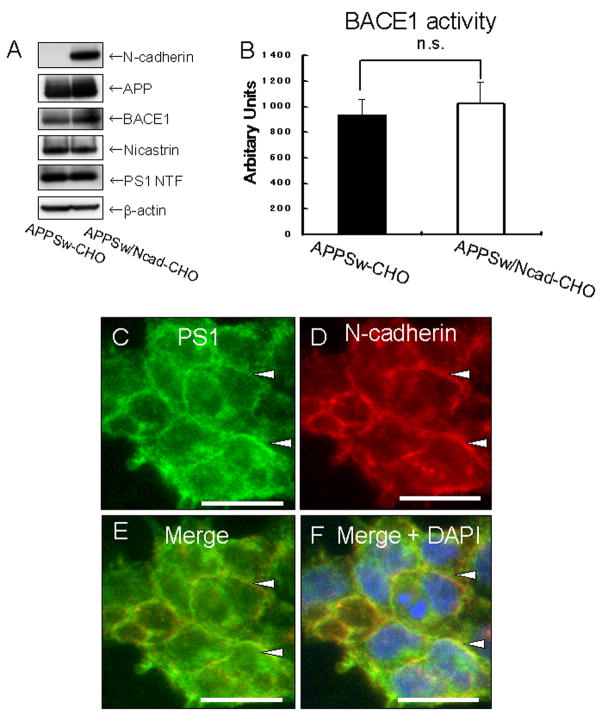
Figure 1. Characterization of APPSw/Ncad-CHO cells.
(A) APPSw-CHO cells and APPSw/Ncad-CHO cells were analyzed by Western blot. N-cadherin was expressed only in APPSw/Ncad-CHO cells. The expression levels of APP, BACE1, nicastrin, PS1 NT were similar in both cell lines. The bottom lane indicates the β-actin level, which was used as a loading control.
(B) APPSw-CHO cells and APPSw/Ncad-CHO cells were lysed and β-secretase activity in the lysate was measured. No significant difference was found between these cell lines (p=0.15, n=4).
(C–F) APPSw/Ncad-CHO cells were immunostained with with rabbit polyclonal anti-PS1 NT (C) and mouse monoclonal anti-N-cadherin antibodies (D). Merged image is shown in (D). Merged image with nuclear DAPI staining is shown in (F). The fixed samples were analyzed by BZ-9000 fluorescent microscopy (KEYENCE). N-cadherin (D) and PS1 (C) immunoreactivities are co-localized at the cell-cell contact sites (arrowheads). Scale bar: 20μm

