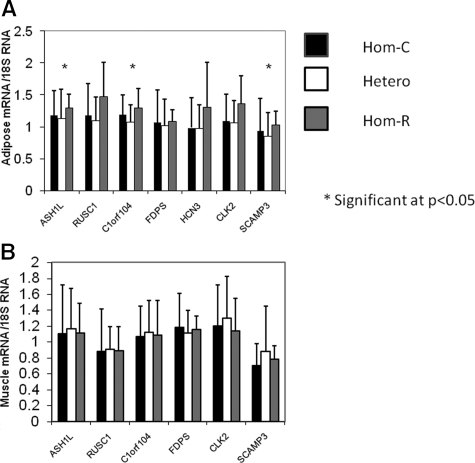
Figure 3.
Gene expression in adipose and muscle by genotype. Gene expression levels normalized to 18S RNA are shown for each haplotype combination. A, Adipose gene expression. C1orf104 was significant on ANOVA (P = 0.036), whereas genes ASH1L and SCAMP3 showed significant differences (P = 0.023 and P = 0.014, respectively) under a recessive model by independent t test. B, Muscle gene expression. No differences were significant. Means and error bars represent sd values on the linear scale; significance was determined using ln-transformed values. Significance is marked by an asterisk.

