Figure 3.
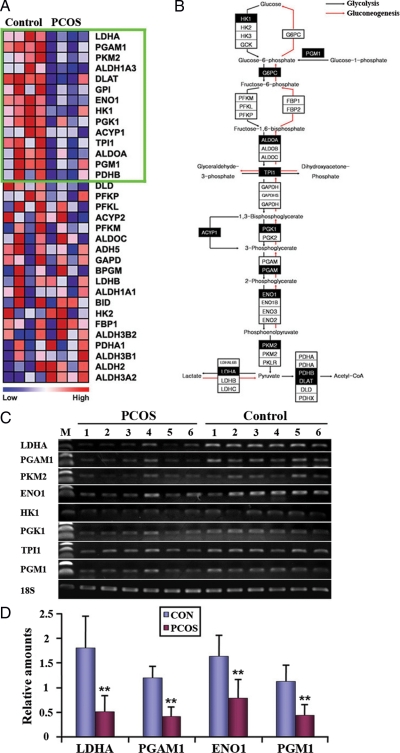
Enzymes for glycolysis are systemically down-regulated in PCOSE. A, A heatmap of genes in the Glycolysis and Gluconeogenesis gene set. The color spectrum from blue to red indicates low to high expression. Genes within the green box are leading characters for building enrichment scores in normal endometrium (NE). B, An interactive map of Glycolysis and Gluconeogenesis that was originally adapted from GenMAPP.org and modified to illustrate genes that are down-regulated in the PCOSE in concert. Black boxes point out leading factors for enrichment scores in NE. Note that enzymes that work in glycolysis, but not gluconeogenesis, such as HK1, PGM1, ACYP1, and PKM2, are consistently down-regulated in PCOSE. C and D, Semiquantitative and real-time RT-PCR of glycolysis-related genes. Control (CON) and PCOS represent NE and PCOSE, respectively (n = 6 each). Relative amounts of LDHA, PGAM1, ENO1, and PGM1 in panel D were normalized by 18S. **, P < 0.01.

