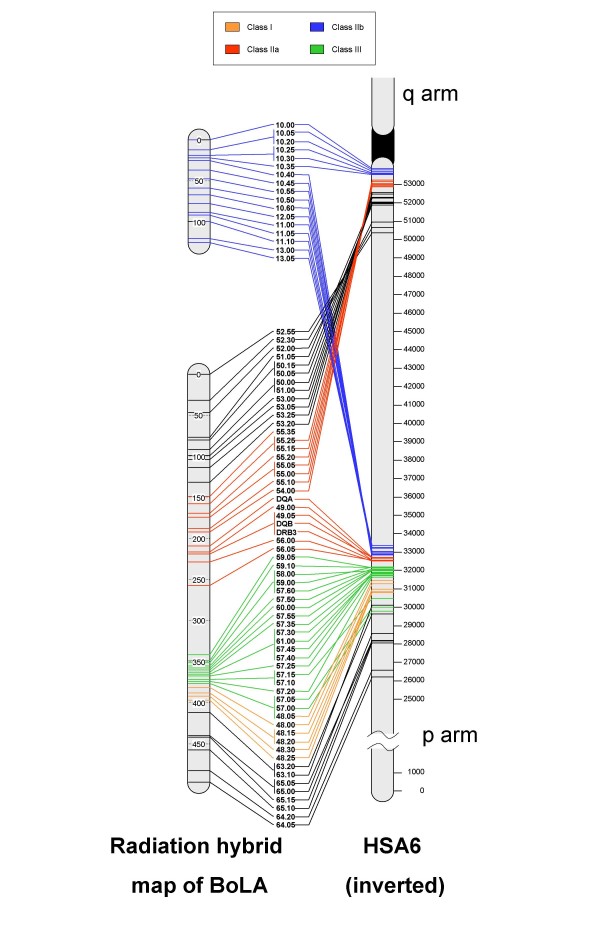
Figure 2.
Comparison of BoLA RH map with homologous human region. Comparison of the high-resolution radiation hybrid map developed in this study with the corresponding region of human chromosome 6 (HSA6). The radiation hybrid map of BoLA is on the left, with units given as cR. Marker names to the right of this are in the order determined through RH mapping. A representative map of HSA6 (with inverted orientation) is located at the far right; connecting lines provide a comparative view of the marker order between the RH map and HSA6. The centromere is represented as a black region in between the two arms, which are labeled "q arm" and "p arm", and distances are given in Kb.

