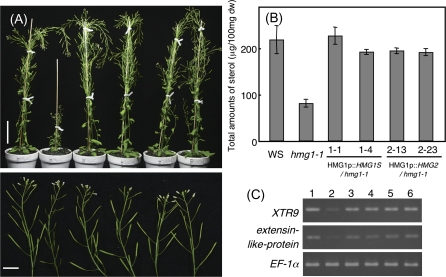
Fig. 3.
Phenotypic analyses of hmg1-1 complementation lines. (A) Left to right, upper figure: mature WS, hmg1-1, 1.1, 1.4, 2.13, and 2.23 plants. Scale bar indicates 5 cm. Left to right, lower figure: close-up photos of inflorescences of WS, hmg1-1, 1.1, 1.4, 2.13, and 2.23 plants. Scale bar indicates 1 cm. (B) Total sterols (μg 100mg−1 dry weight) in WS, hmg1-1, 1.1, 1.4, 2.13, and 2.23 plants. (C) The effect of HMG1S and HMG2 expressed in hmg1-1 plants on XTR9 and extensin-like-protein expression. Total RNA was extracted from 2-week-old seedlings of WS (1), hmg1-1 (2), 1.1 (3), 1.4 (4), 2.13 (5), and 2.23 (6) plants. EF-1 transcripts were amplified as a control.

