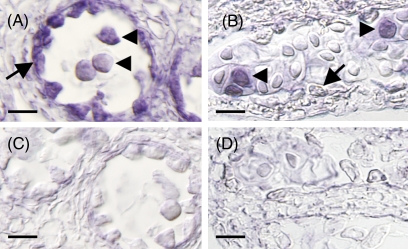
Fig. 7.
Comparison of HMG1 and HMG2 expression in anthers using in situ hybridization. Sections of an anther hybridized with antisense HMG1 (A) or HMG2 (B) probes. Sections of an anther hybridized with sense HMG1 (C) or HMG2 (D) probes as a control. Arrows and arrowheads indicate the tapetum and microspores, respectively. Scale bars indicates 10 μm.

