Abstract
An investigation aimed at a better understanding of the molecular adaptation mechanisms of salt stress was carried out in 7-d-old tomato Solanum lycopersicum (L.) Mill cultivars Patio and ‘F144’, using a proteomic approach. Total proteins were extracted from radicles and hypocotyls collected from both non-saline control and salt-stressed seedlings, and separated by two-dimensional gel electrophoresis. Liqud chromatography-electron spray ionization tandem mass spectrometry (LC-ESI-MS/MS) identified 23 salt stress response proteins, classified into six functional categories. The effect of exogenously applied glycinebetaine (GB) on the salt stress-induced inhibition of growth in tomato seedlings of cultivars Patio and ‘F144’ and on the protein profile was investigated. It was found that GB could alleviate the inhibition of tomato growth induced by salt stress through changing the expression abundance of six proteins in Patio and two proteins in ‘F144’ more than twice compared with salt-stressed seedlings. Furthermore, the interaction analysis based on computational bioinformatics reveals major regulating networks: photosystem II (PSII), Rubisco, and superoxide dismutase (SOD). The results suggest that it is likely that improvement of salt tolerance in tomato might be achieved through the application of exogenous compatible solutes, such as GB. Moreover, quantitative and qualitative analysis of the differentially expressed proteins of tomato under salt stress is an important step towards further elucidation of mechanisms of salt stress resistance.
Keywords: Bioinformatics, exogenous application, glycinebetaine, proteomics, tomato (Solanum lycopersicum) genotypes
Introduction
Salinity is a major environmental constraint limiting yield of crop plants in many semi-arid and arid regions. The initial and primary effect of salinity, especially at low to moderate concentrations, is due to osmosis (Munns and Termaat, 1986). Most crops tolerate salinity up to a threshold level, above which yields decrease as salinity increases (Maas, 1986). Development of salt-tolerant plants would make possible an improved utilization of saline soil and water.
Plant salt tolerance is generally thought of in terms of the inherent ability of the plant to withstand the effects of high salt concentration in the rhizosphere or in the leaves without significant adverse consquencess. Maintenance of growth rate, preserving nutrients, avoiding ion toxicities, and inducing metabolite changes that improve water balance are probably the most common and universal characteristics of salt-tolerant plants.
Tomatoes, one of the world's most important and widespread crops, are classified as moderately salt tolerant (Maas, 1986). Salinity reduced tomato yield (Sonnenveld and Welles, 1988), but improved fruit quality traits, such as total soluble solids, acid contents, and colour (Martinez et al., 1987). Formerly, most of tomato growth was mainly in soil, while at present cultivation has switched to greenhouse soilless cultures. The principal salinity problem is the accumulation of Na and Cl, as these elements are abundantly present in many irrigation waters and absorbed by most crops. As a result, Na and Cl accumulate in the root environment, and high concentrations can readily be reached in small volumes of growing media as used in the soilless culture systems. It has been found that salt concentrations (mostly sodium and chloride) in leaves reach toxic levels in sensitive genotypes much faster than in salt-tolerant genotypes. This has been attributed primarily to the ability of roots to exclude the salt from the xylem sap flowing to the shoot. Rates of accumulation of Na and/or Cl in the shoot are the critical processes determining genotypic differences in salt tolerance (Storey and Walker, 1999; Kusvuran et al., 2007). Large differences are apparent in tolerance of different varieties of tomatoes. A distinctive difference in salt tolerance was obtained with fresh market, cultivated tomatoes (Alian et al., 2000).
Osmotic adjustment, at the physiological level, is an adaptive mechanism involved in drought or salinity tolerance, which permits the maintenance of turgor under conditions of water deficit, as it can counteract the effects of a rapid decline in leaf water potential (Hsiao et al., 1973; Cutler and Rains, 1978; Morgan, 1984). It occurs by the accumulation of high concentrations of either inorganic ions or low molecular weight organic solutes. Although they play a crucial role in higher plants grown under saline conditions, their relative contribution varies among species, among cultivars, and even between different compartments within the same plant. There is strong evidence that glycinebetaine (GB) and proline play an adaptive role in mediating osmotic adjustment and protecting the subcellular structures in stressed plants, stabilizing photosynthetic reactions, the structure of extrinsic proteins of the photosystem II (PSII) complex, and ATP synthesis and activation of enzymes (McCue and Hanson, 1990; Mamedov et al., 1991; Delauney and Verma, 1993; Rhodes and Hanson, 1993; Kishitani et al., 1994; Heuer, 1994; Gorham, 1995). Exogenous application of compatible solutions has been suggested as an alternative/additional approach to genetic engineering to improve crop productivity under stress conditions (Itai and Peleg, 1982). Although the application of exogenous GB to salt-stressed plants was described several decades ago and its function has been relatively well characterized (Rahman et al., 2002), its effect on protein responsiveness has not yet been completely defined and a detailed understanding of many of its cellular functions has proved elusive. DNA microarray analysis was used to identify genes whose expression was enhanced by the exogenous application of GB to both leaves and roots of Arabidopsis (Einset et al., 2007). Genes whose expression was enhanced by GB included genes for transcription factors, for membrane trafficking components, for reactive oxygen species (ROS)-scavenging enzymes, and for NADP-dependent ferric reductase that is located on the plasma membrane.
Tomato plants are not able to synthesize GB but are able to take it up when it is applied to the leaves (Makela et al., 1996). They may provide a good model system for investigating the use of exogenous application when plants grow under environmental stress. Preliminary studies have shown that exogenous addition of compatible solution to young tomato roots induced tolerance to stress conditions (BH, unpublished), although it was previously reported that neither proline nor GB are able to counteract salt stress effects in old salt-sensitive fresh market tomato plants (Heuer, 2003). It is assumed that the age at which plants are exposed to exogenous GB plays a critical role.
Salt-induced changes in polypeptide synthesis are often more pronounced in the root compared with the shoot (Guilick and Dvorak, 1987). Several studies on the molecular responses to water deficit have been undertaken (Ingram and Bartels, 1996; Shinozaki and Yamaguchi-Shinozaki, 1996). For example, most of the genes involved are also induced by exogenous application of abscisic acid (ABA) (Chandler and Robertson, 1994; Shinozaki and Yamaguchi-Shinozaki, 1997). The proteins encoded by drought-induced genes are supposed to play an important role in water stress response. They confer desiccation tolerance, protect cellular structures, or are involved in the signal transduction pathway that leads to gene induction under these conditions. Salt tolerance of plants could depend on High-affinity K+ Transporter transporters (HKT), which mediate Na+-specific transport or Na+-K+ transport and play a key role in regulation of Na+ homeostasis (Rodríguez-Navarro and Rubio, 2006; Munns and Tester, 2008). DNA microarray technology, especially the use of GeneChip microarrays, has become a standard tool for parallel gene expression analysis. Recent improvements in GeneChip microarrays enable whole-genome expression analysis, and thus open a new avenue for studies of the composition, dynamics, and regulation of the transcriptome in plants. The knowledge produced by microarray studies has led to a new level of understanding of the mechanism of transcription and of cellular functions (Zhu, 2003).
Proteomic analysis provides a broad view of plant responses to stress at the level of proteins. In recent years, the term proteomics has also been applied to all the proteins expressed in a particular organelle or tissue or in response to a particular stress. Thus, we can talk of the proteomics of drought or salt stress with the emphasis being on a global analysis of how cells and organism respond to these stresses at the protein levels. Proteomic studies have revealed which proteins are responsible for cell differentiation in Arabidopsis under salt and osmotic stress (Ndimba et al., 2005) and drought responsiveness in maritime pine (Costa et al., 1998), maize (Riccardi et al., 1998), and wild watermelon (Kawasaki et al., 2000).
The purpose of this study was: (i) to determine the number of proteins significantly changed in young tomato seedlings in response to salt stress; (ii) to determine the effect of exogenous GB on protein responsiveness of salt stresses and (iii) to show that the responsive proteins cluster into cohesive groups based on function or response. Two-dimensional electrophoresis/mass spectrometry (2-DE/MS) techniques were used to detect changes in the levels of protein expression and reveal the major regulating networks based on computational bioinformatics. In addition the proteome-level differences between two tomato fresh market cultivars differing in their tolerance to salinity were also characterized.
Materials and methods
Plant material, growth conditions, and stress treatments
Seeds of tomato (Solanum lycopersicum, formerly Lycopersicon esculentum, Mill. cv. ‘F144’ from Hazera, Israel), previously reported as salt sensitive, and L. esculentum L. cv. Patio (Tomato Growers, USA), previously reported as relatively salt tolerant (Alian et al., 2000), were germinated in a growth chamber in darkness at 25±2 °C on Petri dishes (Φ=9 cm) containing two layers of wet filter paper until radicle initiation. Eight uniformly germinated seeds were transferred to new Petri dishes on filter paper imbibed with 2.5 ml of four different Hoagland solutions (A–D) which were then sealed with parafilm. The seedlings were grown under a 12 h photoperiod. The length and fresh weight of both radicles and hypocotyls of 64 seedlings of each osmotic solution were measured after 7 d.
Solution A was half-strength Hoagland solution (Arnon, 1938) and served as the control treatment. Solution B contained half-strength Hoagland and 120 mM sodium chloride, solution C was as solution B plus 5 mM GB, and solution D was half-strength Hoagland and 5 mM GB. The concentration of 5 mM GB was chosen following some preliminary experiments (data not shown).
Protein extraction
Proteins of the tomato radicles and hypocotyls were extracted with phenol according to Chen et al. (2006). For the protein assay, the Standard Procedure for Microtiter Plates was used according to the instruction manual for the Sigma protein assay (Bicinchoninic acid protein assay kit, product code BCA-1 and B9643).
Two-dimensional gel electrophoresis (2-DE)
2-DE was performed using immobilized pH gradients (Amersham Biosciences) according to the manufacturer's directions with some modifications. For analytical and preparative gels, the 13 cm IPG strips (pH 4–7) (Amersham Pharmacia Biotech) were rehydrated overnight with 250 μl of rehydration stock solution [9 M urea, 3% (w/v) CHAPS, 0.5% (v/v) Triton X-100, 2% (v/v) IPG buffer, and 0.002% (w/v) bromophenol blue], containing 60 μg of protein, at room temperature. Immunoelectrophoresis (IEF) was conducted at 18°C with a Pharmacia Multiphor II. The running condition were: 300 V for 15 min, followed by 500 V for 15 min, 1000 V for 15 min, 1500 V for 15 min, 2000 V for 15 min, 2500 V for 15 min, 3000 V for 15 min, and finally 3500 V for 5 h. The focused strips were equilibrated twice for 15 min in 10 ml of equilibration solution. The first equilibration was performed in a solution containing 50 mM TRIS-HCl, pH 8.8, 6 M urea, 30% (v/v) glycerol, 2% (w/v) SDS, 0.002% bromophenol blue, and 2 mM tributylphosphine (TBP), and the second equilibration was the same except that TBP was replaced by 2.5% (w/v) iodoacetamide. The second dimension was carried out by SDS–PAGE in a vertical slab of 12.5% acrylamide using an SE 600 Series Vertical Slab Gel Unit (Hoefer Scientific Instruments, San Francisco, CA, USA). Preparative gels were stained with colloidal Coomassie brilliant blue G-250 (Neuhoff et al., 1988). Silver staining was performed on top of colloidal Coomassie staining (Yan et al., 2000). In the silver staining, the sensitization step was omitted, and in the step for stopping development, EDTA was replaced by 1% acetic acid. The protein spots in analytical gels were visualized by silver staining (Veeranagamallaiah et al., 2008; Zhang et al., 2008). Three independent biological replications were carried out to validate the results.
Image and data analysis
Gel matching for protein quantification was performed by Z3 (Compugen Inc., Tel Aviv, Israel) and Delta 2D (DECODON GmbH, Greifswald, Germany) software, and spot pairs were confirmed visually. The abundance of each protein spot was estimated by the percentage volume (% Vol). Only those with significant and reproducible changes were considered to be differentially accumulated proteins.
Protein analysis by mass spectrometry
MS electron spray ionization (ESI)-trap analysis of proteins was performed at the Smoler Proteomics Center of the Department of Biology, Technion-Israel Institute of Technology. The differential spots stained with colloidal Coomassie blue G-250 were cut and in-gel proteolysed with trypsin. The resulting peptides were resolved by reverse-phase HPLC and microsprayed directly into the ESI-trap mass spectrometer (DecaXP, ThermoFinnigan, San Jose, CA, USA). The collected data were compared with simulated proteolysis and fragmentation of known proteins in the NCBI-nr database using Pep-Miner software. The protein analysis was repeated twice.
Statistical analysis
The general linear model procedure of SAS (1988) was used for analysis of variance for length and fresh weight of tomato seedlings. The significance of differences between treatments was determined by using Scheffe's test at P <0.05.
Results
Effect of exogenous GB on the growth of salt-stressed tomato seedlings
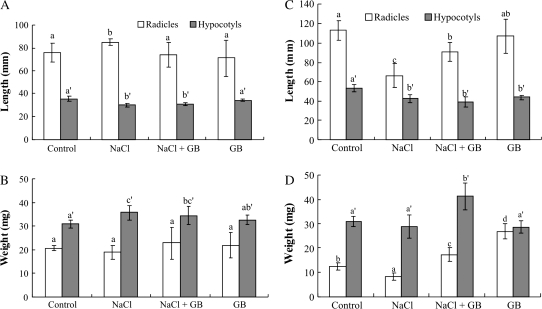
Growth was followed by measuring the lengths and fresh weights of radicles and hypocotyls of the tomato seedlings. GB could not nullify the inhibitory effect of NaCl on the length of hypocotyls from cv. Patio, but fully restored salt inhibition of radicle elongation (Fig. 1A). Fresh weight of hypocotyls in the presence of salt and GB was lower than with salt alone (Fig. 1B). It is important to mention that the addition of only GB yielded a similar response to that of the control. The length of radicles and fresh weight of ‘F144’ in salt treatment were significantly increased by GB treatment (Fig. 1C, 1D).
Fig. 1.
Effect of exogenous glycinebetaine on growth of salt-stressed tomato seedlings, Solanum lycopersicum (L.) Mill cv. Patio (A and B) and ‘F144’ (C and D). Bars represent the standard error of the means. Bars with the same letter(s) do not differ significantly according to Scheffe's test (P <0.05). (A) Length; (B) Fresh weight.
Protein profile responsiveness to salt stress
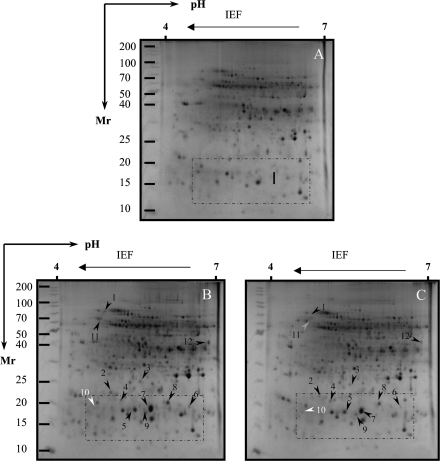
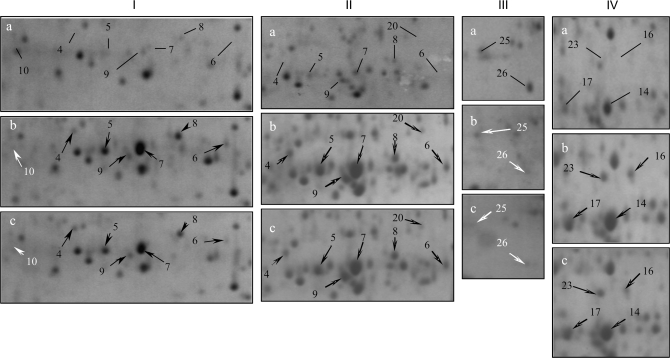
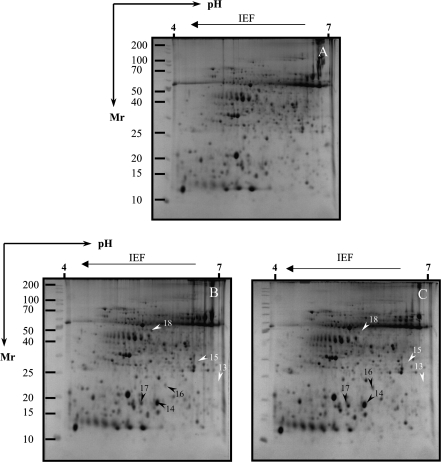
Proteins whose levels were altered by salt stresses were excised and purified from 2D-PAGE gels. After silver staining, >1000 tomato radicle protein spots were detected by digital image analysis, and at least 400 spots gave reproducible staining patterns for all samples as judged by eye and by spot intensity ranking using Z3 software. Exposure of Patio seedlings to 120 mM NaCl for 7 d revealed 12 radicle spots (Figs 2B, 6I, 7B) which were significantly altered in their intensity as compared with the non-saline controls (Fig. 2A). Spot 10 was down-regulated, while all the others were up-regulated. In the hypocotyls, six spots were significantly altered in intensity as compared with those seen in the non-saline controls (Fig. 3A); three of them (spots 14, 16, and 17) were up-regulated, and three other spots (spots 13, 15, and 18) were down-regulated (Fig. 3B, 6II, 7C).
Fig. 2.
Silver-stained 2-D gel protein profiles of radicles from salt-stressed tomato cv. Patio in the presence or absence of exogenous glycinebetaine (GB). (A) Non-saline control; (B) 120 mM NaCl treatment; (C) 120 mM NaCl+5 mM GB treatment. The white and black arrows indicate proteins that showed detectable changes in abundance compared with those seen in the control; white indicates a down-regulated match, and black indicates an up-regulated match. The grey arrow indicates proteins that showed no or slightly detectable changes in abundance compared with those seen in the control. Small boxes indicate the gel regions to be amplified to highlight clear detectable spots in Fig. 6.
Fig. 6.
Amplification of small boxes from Figs 2, 4, and 5 to highlight clearly detectable spots that represent differentially abundant expression. In I, II, III, and IV: (a) non-saline control; (b) 120 mM NaCl treatment; (c) 120 mM NaCl+5 mM GB treatment.
Fig. 7.
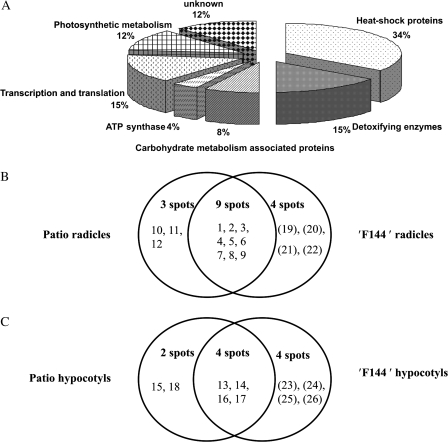
Functional categories of proteins identified in the radicles and hypocotyls collected from both non-saline control and salt-stressed tomato seedlings, cv. Patio and ‘F144’ (A). Number of spots altered in expression in the radicles (B) and hypocotyls (C) of tomato cv. Patio and ‘F144’ under salt stress. After gel analysis and manual editing with Delta 2D software, the total number of spots altered in expression (≥2.0-fold the normalized volume) were counted. The spot numbers in parentheses are differentially expressed in ‘F144’, and the spot numbers without parentheses are differentially expressed in Patio.
Fig. 3.
Silver-stained 2-D gel protein profiles of hypocotyls from salt-stressed tomato cv. Patio in the presence or absence of exogenous GB. (A) Non-saline control; (B) 120 mM NaCl treatment; (C) 120 mM NaCl+5 mM GB treatment. The white and black arrows indicate proteins that showed detectable changes in abundance compared with those seen in the control; white indicates a down-regulated match, and black indicates an up-regulated match.
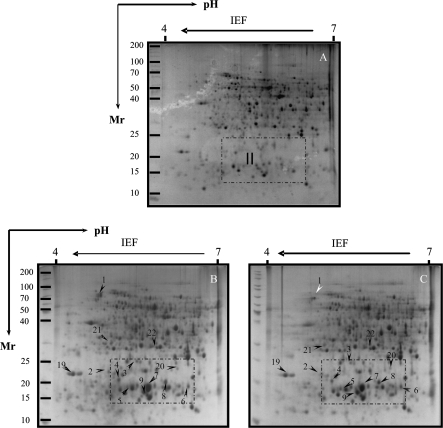
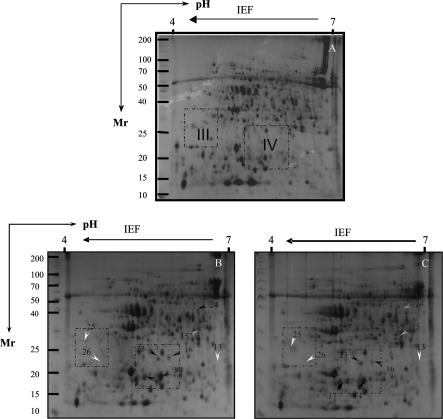
Thirteen spots were detected to be significantly up-regulated in their intensity in the radicles of ‘F144’ seedlings exposed to 120 mM NaCl for 7 d as compared with the non-saline controls (Figs 4B, 7B). Eight other spots showed significant changes in intensity in the hypocotyls of ‘F144’ compared with those seen in non-saline control, of which five spots (spots 14, 16, 17, 23, and 24) were up-regulated and three spots (spots 13, 25, and 26) were down-regulated (Figs 5B, 6III, IV, 7C).
Fig. 4.
Silver-stained 2-D gel protein profiles of radicles from salt-stressed tomato cv. ‘F144’ in the presence or absence of exogenous GB. (A) Non-saline control; (B) 120 mM NaCl treatment; (C) 120 mM NaCl+5 mM GB treatment. The white and black arrows indicate proteins that showed detectable changes in abundance compared with those seen in the control, white indicates a down-regulated match, and black indicates an up-regulated match. Small boxes indicate the gel regions to be amplified to highlight clearly detectable spots in Fig. 6.
Fig. 5.
Silver-stained 2-D gel protein profiles of hypocotyls from salt-stressed tomato cv. ‘F144’ in the presence or absence of exogenous GB. (A) Non-saline control; (B) 120 mM NaCl treatment; (C) 120 mM NaCl+5 mM GB treatment. The white and black arrows indicate proteins that showed detectable changes in abundance compared with those seen in the control; white indicates a down-regulated match, and black indicates an up-regulated match. The grey arrow indicates proteins that showed no or slightly detectable changes in abundance compared with those seen in the control. Small boxes indicate the gel regions to be amplified to highlight clearly detectable spots in Fig. 6.
Effect of exogenous GB on protein profile responsiveness to salt stress
The effect of exogenous GB on protein responsiveness of salt-stressed cv. Patio seedlings is shown in Table 1a and in Figs 2C, 3C, and 6I. A distinctive variation in the level of protein accumulation was detected when GB was applied together with NaCl. Nine spots (spots 1, 2, 3, 6, 7, 9, 10, 11, and 12) in radicles exposed to 120 mM NaCl and 5 mM GB changed their intensity compared with 120 mM NaCl treatment (Table 1a), in which four of them (spots 1, 6, 11, and 12) showed down-regulation more than twice that seen in the salt-stress treatment. Four spots (spots 15, 16, 17, and 18) in Patio hypocotyls changed their intensity under exogenous application of GB together with salt. However, only two spots (spots 15 and 18) indicated down-regulation in their intensity more than twice that seen in salt-stressed tomato Patio (Table 1a).
Table 1.
Changes in expression of differential proteins in response to salt stress in tomato seedlings, cv. Patio and ‘F144’ (changes <2.0-fold are highlighted in bold italic)
| (a) | |||||
| Fold change in Patio radicles |
Fold change in Patio hypocotyls |
||||
| Spot number* | NaCl | NaCl+GB | Spot number | NaCl | NaCl+GB |
| 1 | (+) 31.3±1.95 | (+) 13.5±0.31 | 13 | (–) ∞ | (–) ∞ |
| 2 | (+) 31.7±0.82 | (+) 22.0±0.17 | 14 | (+) 4.1±0.22 | (+) 4.4±0.28 |
| 3 | (+) 6.5±0.35 | (+) 5.3±0.34 | 15 | (–) 4.2±0.69 | (–) 25.0±1.49 |
| 4 | (+) 9.5±0.32 | (+) 9.4±0.18 | 16 | (+) 133.0±9.61 | (+) 217.0±10.67 |
| 5 | (+) 4.7±0.13 | (+) 4.2±0.15 | 17 | (+) 4.6±0.36 | (+) 5.5±0.45 |
| 6 | (+) 9.9±1.69 | (+) 4.5±0.76 | 18 | (–) 2.2±0.26 | (–) 6.7±0.53 |
| 7 | (+) 11.3±0.61 | (+) 10.6±0.37 | |||
| 8 | (+) 5.2±0.21 | (+) 4.8±0.25 | |||
| 9 | (+) 7.5±0.31 | (+) 6.3±0.30 | |||
| 10 | (–) 6.7±0.17 | (–) 4.4±0.11 | |||
| 11 | (+) ∞ | (+) 1.0±0.11 | |||
| 12 | (+) 11.3±1.57 | (+) 4.5±0.61 | |||
| (b) | |||||
| Fold change in ‘F144’ radicles |
Fold change in ‘F144’ hypocotyls |
||||
| Spot number | NaCl | NaCl+GB | Spot number | NaCl | NaCl+GB |
| (+) 11.6±0.44 | (–) 4.9±0.16 | 13 | (–) ∞ | (–) ∞ | |
| (+) 4.5±0.25 | (+) 5.5±0.26 | 14 | (+) 2.6±0.08 | (+) 2.7±0.15 | |
| (+) 2.6±0.65 | (+) 1.7±0.16 | 15 | (–) 1.4±0.47 | (+) 1.1±0.13 | |
| (+) 18.3±2.17 | (+) 15.7±1.71 | 16 | (+) 15.5±2.44 | (+) 11.8±1.85 | |
| (+) 3.5±0.21 | (+) 3.6±0.21 | 17 | (+) 2.6±0.13 | (+) 2.6±0.13 | |
| 1 | (+) 7.8±0.37 | (+) 8.0±0.38 | 23 | (+) 2.5±0.29 | (+) 3.7±0.44 |
| 2 | (+) 10.5±0.19 | (+) 10.1±0.14 | 24 | (+) 5.8±0.84 | (+) 1.4±0.20 |
| 3 | (+) 4.8±0.11 | (+) 3.9±0.32 | 25 | (–) 3.9±0.25 | (–) 2.9±0.22 |
| 4 | (+) 2.0±0.09 | (+) 2.7±0.11 | 26 | (–) 3.1±0.13 | (–) 5.9±0.29 |
| 5 | (+) 3.8±0.13 | (+) 3.3±0.11 | |||
| 20 | (+) 12.3±1.50 | (+) 10.1±1.27 | |||
| 21 | (+) 9.5±0.80 | (+) 8.4±0.78 | |||
| 22 | (+) ∞ | (+) ∞ | |||
After gel analysis and manual editing with Delta 2D software the total number of spots showing altered expression (≥2.0-fold the normalized volume) were counted. Spot abundance is expressed as the ratio of intensities between salt stresses and the non-saline control. Each value represents the mean ±SE of triplicates. Protein spots whose abundance increased (+) or decreased (–) following salt treatments are shown.
There are two spots (spots 1 and 24) in tomato ‘F144’ seedlings exposed to 120 mM NaCl and 5 mM GB that were altered in intensity compared with those seen in salt-stressed treatment; one spot (spot 1) in the radicles and one spot (spot 24) in the hypocotyls was down-regulated more than twice that seen in salt-stressed treatment (Table 1b, Figs 4C, 5C, 6II–IV).
Functional grouping of identified proteins
Protein spots exhibiting differential expression on gels from different salt-stressed tomato seedlings were analysed by LC-ESI-MS on a DECA/LCQ and identified by Pep-Miner and request software against the NCBI database of all plants including tomato. Twenty-six proteins and their annotated functions were identified from the survey of gene banks (Table 2, and Supplementary Table 1 available at JXB online). Functionally, nine proteins were heat-shock proteins (HSPs), four proteins were related to detoxifying enzymes, two proteins were carbohydrate metabolism-associated proteins, one protein was ATP synthase, four proteins had the function of transcription and translation, and three proteins were involved in photosynthetic metabolism. Other spots, however, remained unidentified, including spots 19, 20, and 26 (Fig. 7A).
Table 2.
Expression of the classified proteins under salt stresses
| Spot number* | Identification | GI number† | Predicted mol. wt (kDa)/pI | Observed mol. wt (kDa)/pI |
| Heat-shock proteins | ||||
| 1 | Chaperone protein DnaK [Oryza sativa (japonica cultivar group)] | 77554415 | 74.1/5.1 | 71.3/4.9 |
| 2 | Mitochondrial small heat shock protein (Solanum lycopersicum) | 3492854 | 23.8/6.5 | 21.5/5.0 |
| 5 | Hsp20.1 protein (Lycopersicon peruvianum) | 3341464 | 17.7/5.8 | 18.0/5.4 |
| 7 | 17.6 kDa class I small heat shock protein (S. lycopersicum) | 4836473 | 17.6/5.8 | 18.3/5.8 |
| 14 | 17.7 kDa class I small heat shock protein (S. lycopersicum) | 4836469 | 17.8/5.8 | 17.9/5.7 |
| 9 | 17.8 kDa class I small heat shock protein (S. lycopersicum) | 4836471 | 17.8/5.6 | 16.6/5.6 |
| 11 | Chaperonin 60 α subunit (Canavalia lineata) | 3790441 | 61.4/5.2 | 61.9/4.8 |
| 16 | Chloroplast heat shock protein (S. lycopersicum) | 1518139 | 26.2/7.8 | 22.5/5.9 |
| 17 | Hsp20.0 protein (L. peruvianum) | 3336892 | 17.6/5.2 | 18.1/5.4 |
| Detoxifying enzymes | ||||
| 3 | Ferritin (Malus xiaojinensis) | 15080913 | 28.1/5.7 | 24.0/5.5 |
| 8 | Temperature-induced lipocalin (S. lycopersicum) | 77744859 | 21.3/6.0 | 20.1/6.1 |
| 13 | Osmotin-like protein (Solanum phureja) | 53830834 | 27.4/5.8 | 22.8/6.9 |
| 22 | Cytosolic ascorbate peroxidase (Fragaria×ananassa) | 5257554 | 27.3/5.7 | 28.6/5.9 |
| Carbohydrate metabolism-associated proteins | ||||
| 6 | Glyceraldehyde 3-phosphate dehydrogenase (S. lycopersicum) | 31088230 | 28.9/5.7 | 19.2/6.5 |
| 12 | Mitochondrial formate dehydrogenase precursor (Solanum tuberosum) | 11991527 | 42.0/6.6 | 41.6/6.9 |
| ATP synthase | ||||
| 10 | Mitochondrial ATPase beta subunit (Nicotiana sylvestris) | 3676294 | 59.9/5.8 | 18.2/4.7 |
| Transcription and translation | ||||
| 18 | Chloroplast elongation factor TuB (EF-TuB) (N. sylvestris) | 218312 | 46.7/5.7 | 47.8/5.6 |
| 23 | Ribosomal protein L12-1 (Nicotiana tabacum) | 20018 | 19.6/6.3 | 23.1/5.7 |
| 24 | Mitochondrial elongation factor Tu (Arabidopsis thaliana) | 1149571 | 51.4/5.5 | 19.5/6.5 |
| 25 | Nascent polypeptide-associated complex subunit α-like protein 3 (A. thaliana) | 71151986 | 22.0/4.4 | 27.7/4.4 |
| Photosynthetic metabolism | ||||
| 4 | Photosystem II 23 kDa protein (S. lycopersicum) | 19317 | 27.8/8.3 | 20.6/5.2 |
| 15 | Ribulose-1,5-bisphosphate carboxylase/oxygenase large subunit (Juanulloa aurantiaca) | 475734 | 52.0/6.4 | 29.6/6.5 |
| 21 | 33 kDa precursor protein of oxygen-evolving complex (S. tuberosum) | 809113 | 35.3/5.9 | 33.3/5.1 |
| Some of the unidentified spots | ||||
| 19 | No significant match found | 21.8/4.3 | ||
| 20 | No significant match found | 23.0/6.2 | ||
| 26 | No significant match found | 23.6/4.8 | ||
Responsive protein pattern in salt-stressed tomato seedlings of cultivars ‘F144’ and Patio
Nine proteins in radicles, including five HSPs, ferritin, PSII23 kDa protein, glyceraldehyde 3-phosphate dehydrogenase (GAPHD), and temperature-induced lipocalin, in both cultivars, Patio (spots 1–9) and ‘F144’ (spots 1–9), changed in expression under salt stress compared with non-saline controls (Tables 1, 2, Fig. 7B). Furthermore, three HSPs (chaperone protein DnaK, mitochondrial small HSP, and 17.8 kDa class I small HSP) in Patio (spots 1, 2, and 9) were markedly up-regulated compared with those seen in ‘F144’, ferritin in Patio (spot 3) indicated a significant up-regulation more than that in ‘F144’, and PSII in ‘F144’ (spot 4) showed a high expression in comparison with Patio. Three other proteins, mitochondrial ATPase β-subunit (spot 10), chaperonin 60 α-subunit (spot 11), and mitochondrial formate dehydrogenase (mFDH) precursor (spot 12), changed their expression only in radicles of Patio, and four proteins including 33 kDa precursor protein of oxygen-evolving complex (OEC) (spot 21), cytosolic ascorbate peroxidase (cAPX) (spot 22), and two unidentified spots (spots 19 and 20) changed their expression abundance only in the radicles of ‘F144’ (Fig. 7, Tables 1, 2).
Four proteins, osmotin-like protein (OLP) (spot 13), 17.7 kDa class I small HSP (spot 14), chloroplast HSP (spot 16), and Hsp20.0 protein (spot 17), changed their expression in hypocotyls of both cultivars exposed to salt stress (Fig. 7C). However, chloroplast HSPs in Patio were up-regulated more than twice compared with ‘F144’, and a ribulose-1,5-bisphosphate carboxylase/oxygenase (Rubisco) large subunit protein in Patio (spot 15) was down-regulated more than twice compared with ‘F144’. Another protein, chloroplast elongation factor TuB (cEF-TuB) (spot 18), differentially changed its expression only in Patio hypocotyls, and four proteins, including ribosomal protein L12-1 (spot 23), mitochondrial elongation factor Tu (mEF-Tu) (spot 24), nascent polypeptide-associated complex subunit α-like protein 3 (NAC-α-like protein 3) (spot 25), and one unidentified spot (spot 26), changed differentially in their expression only in ‘F144’ hypocotyls (Fig. 7, Tables 1, 2).
Protein interaction networks under salt stresses
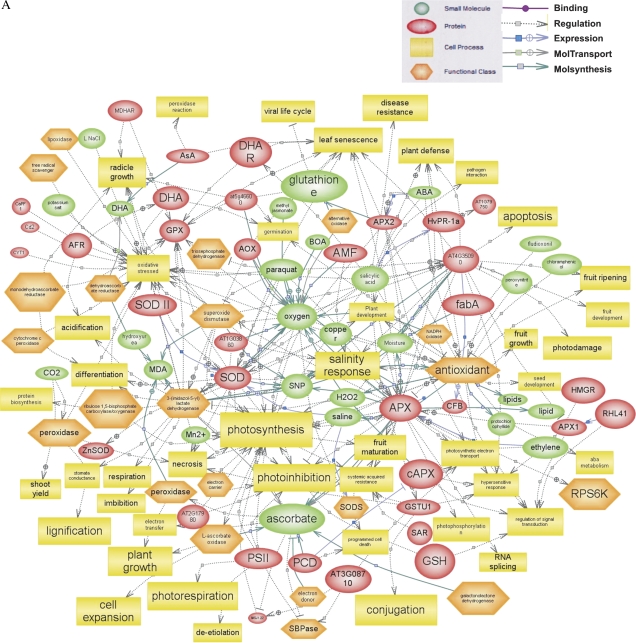
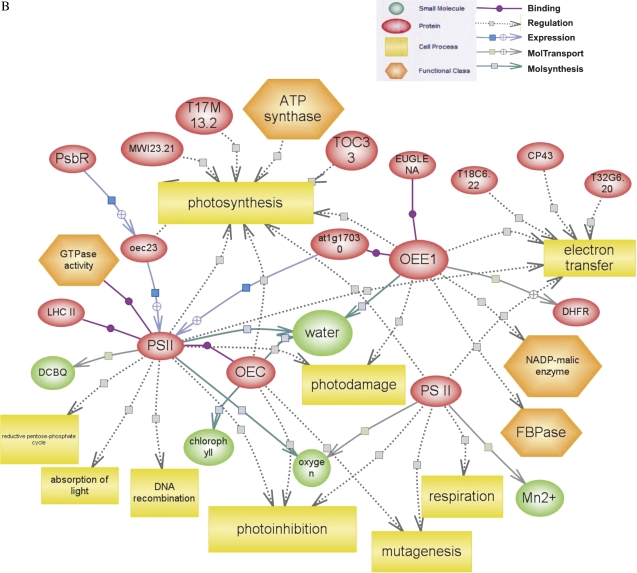
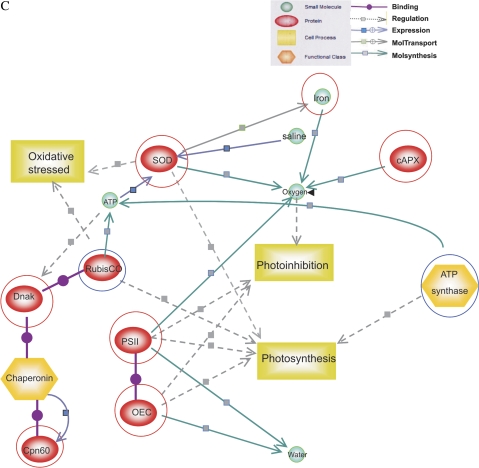
All the proteins identified from salt-stressed tomatoes cvs Patio and ‘F144’ were used to generate a wider protein interaction map by employing a Pathway Studio software program (www.ariadnegenomics.com). cAPX, PSII, OEC, and Rubisco were matched to the Pathway Studio data for generating maps; the function of representative proteins are shown in Supplementary Tables S2 and S3 at JXB online. Each of these proteins is represented by coloured circles in the network (Fig. 8). Separate subnetworks for each stressed group were generated and then merged to obtain a wide network of interactions. The major regulating network and the signalling pathways contributed by these networks appeared to be PSII, Rubisco, and superoxide dismutase (SOD) for complex salt stress.
Fig. 8.
Biological networks generated for salt-stressed tomato seedlings through Pathway Studio analysis. A, B, and C showed the molecular interaction networks representative for salt stress. The red or blue circles indicate up- or down-regulation.
Discussion
Salts naturally affect a myriad of cellular activities, primarily because they perturb the water content of the cell (Mundree et al., 2002; Ndimba et al., 2005). Salinity-induced damage to plants includes membrane disorganization, increase in levels of toxic metabolites, inhibition of nutrient uptake and photosynthesis, generation of ROS, and ultimately cell and plant death. In order to overcome salt stress, plants evolved various physiological, molecular, biochemical, and morphological adaptation mechanisms. With such a profile, it is not a surprise to see protein responsiveness from salt-stressed tomato seedlings involved with such diverse groups as HSPs, detoxifying enzymes, carbohydrate metabolism-associated proteins, ATP synthase, transcription and translation, and photosynthetic metabolism. The differential proteins comprising the radicles and hypocotyls were identified. Although the possibility could not be excluded that some differential proteins were not retained or not identified in the present analysis, it is believed that this number was small. It is clear that, depending on how the staining is performed, silver staining has limitations as a method for gel quantification. Therefore, in the study, the abundance of 10 differential spots was freely quantified. The quantification performed on analytical gels stained by silver, and the results of the quantification of the same gels stained by colloidal Coomassie are also shown (Supplementary Table S4 at JXB online). The quantifications of 10 spots from gels stained by colloidal Coomasie containing samples from seedlings under salt stress were carried out. It can be clearly seen that there are no significant changes between silver staining and colloidal Coomassie staining in the present study. The result of both silver staining and colloidal Coomassie staining never differed by more than 18% under salt stress.
The systematic investigation of molecular differences between two tomato phenotypes and exogenous application of GB under salt stresses have been addressed. The present study involves the MS-based characterization of proteomics and bioinformatics. Characterization of proteomic differences between the two genotypes and exogenous application of GB is crucial given its protein expression pattern. The analysis of biochemically isolated and enriched salt-stressed protein responsiveness showed that the differential protein profile is comprised of 23 distinct proteins.
In the radicles, considerable differences could be identified in the proteome pattern, which may discriminate the effects of salt stress on genotypes and of the exogenously applied GB. The majority of the differentially identified proteins in both cultivars Patio (eight of 12 proteins) and ‘F144’ (eight of 13 proteins) are stress-related proteins involved in cell rescue, defence, and virulence. These stress proteins included all HSPs and the detoxifying enzymes ferritin, temperature-induced lipocalin, and cAPX (only in ‘F144’) (Table 2). SOD accumulated in salt-stressed radicles of both Patio and ‘F144’ (data not shown). It is well known that oxygen deprivation induces oxidative stress through the generation of ROS—especially hydrogen peroxide (H2O2) and superoxide (O2−)—and, consequently, activation of APX and SOD should be crucial to preserve the redox status of the cells (Blokhina et al., 2003). Ferritin was found to accumulate by 6.5- and 2.6-fold in salt-stressed Patio and ‘F144’, respectively. Increased oxidative stress following salt stress might result in the formation of hydroxyl radicals from a reaction between ferrous iron and H2O2. Sequestration of ferrous iron through increased expression of ferritin may act to reduce the production of hydroxyl radicals during salt stress (Parker et al., 2006). In plants, lipocalins were found to be key enzymes of the xanthophyll cycle responsible for protection against photo-oxidative damage (Bugos et al., 1998). It is worth noting the specific accumulation of small HSPs (HSP17.6 and HSP 17.8; HSP 20.1) in radicles. HSPs function as molecular chaperons and assist in protein folding, assembly, and transport, and in directing damaged proteins towards proteolysis (Vierling, 1991); therefore, they may also play a crucial role in protection from salt stress. Indeed, chaperones 60 (only in Patio) and Dnak were previously reported to accumulate in maize root tips after exposure to stress conditions (Chang et al, 2000).
The overexpression of SOD found in the present research may be associated with the increased expression of ferritin in radicles. Presumably high expression of ferritin, SOD, and cAPX increases the rates of oxygen release (Parker et al., 2006), which finally affects photohibition and photosynthesis (Camp et al., 1996) (Fig. 8C).
One of the interesting outcomes of this study is the identification of PSII and the OEC (only in ‘F144’) in radicles. The central unit of PSII, a key component of photosynthesis, is the core complex, in which light is used to split water to molecular oxygen, to reduce plastoquinone and to generate a transmembrane proton gradient (Zouni, 2001; Barber, 2002). An increase or decrease of PSII will affect photosynthesis (Ruban et al., 2003), photodamage (Wykoff et al., 1998), and photoinhibition (Silva et al., 2003) (Fig. 8B, C). OEC, bound to the lumen side of PSII, regulates the formation of the cross-linked products of the reaction centre-binding protein D1 in donor-side photoinhibition of PSII (Yamamoto, 2001).
The present study indicates that nine proteins, which are all stress-related proteins, proteins involved in photosynthetic metabolism, and carbohydrate metabolism-associated proteins, were significantly up-regulated in Patio and ‘F144’ (Table 2). It is obvious to find that these proteins, except for PSII, all increase their abundance in Patio more than in ‘F144’ under salt stress (Table 1), which could partly explain its salt tolerance.
Five differential proteins, including four stress-related proteins (OLP and three HSPs) indentified in the hypocotyls, and Rubisco involved in photosynthetic metabolism, changed their expression in both Patio and ‘F144’ (Table 2). All three HSPs increased their expression in salt-stressed hypocotyls. Surprisingly, OLP, a pathogenesis-related protein, associated with osmotic stress (Rodrigo et al., 1991; Jensen-Jarolim et al., 1998) and with normal developmental processes of the plant (Neale et al., 1990), lost its expression under salt stress. Interestingly, Rubisco showed a marked down-regulation in Patio and a slight decrease in ‘F144’ under salt stress (Table 1). A concomitant decline of ATPase activity and the ability to activate decarbamylated Rubisco has been observed for Rubisco activase in response to salt treatments (Salvucci and Klein, 1994). It seems likely that the residual ATPase activity was insufficient to support Rubisco activation. These interactions could probably explain the down-regulation of ATPase and Rubisco only in Patio after salt stress.
GB is a compatible solute that accumulates in certain plants and microorganisms in response to various types of stress. Ohnishi and Murata (2006) indicated that salt stress inhibited repair of photodamaged PSII while betaine reversed this inhibitory effect. They transformed Arabidopsis, rice, and tomato with the codA gene for choline oxidase, which catalyses the synthesis of betaine from choline, and then these plants accumulated betaine and exhibited, in addition, an enhanced tolerance to salt and cold stress. In the present study, exogenous application of GB to salinized seedlings changed the expression of six proteins by more than twice that in salt stress (Table 1). These include two stress-related proteins (DnaK and chaperonin 60), two carbohydrate metabolism-associated proteins (GAPHD and mitochondrial FDH precursor), Rubisco, and cEF-TuB, a transcription and translation protein in Patio, and two proteins, DnaK and mEF-Tu, in ‘F144’. Other proteins, ATPase, ribosomal protein L12-1, and NAC-α-like protein 3, were also overexpressed. NAC-α-like protein 3 is involved in protein sorting and translocation by preventing mistargeting of nascent polypeptide chains to the endoplasmic reticulum (Rospert et al., 2002). The decreased α-NAC protein level might affect the overall NAC function and ultimately affect the processes of gene transcription, protein translation, and targeting, and inevitably lead to a disordered metabolism (Yan et al., 2005). PSII and OEC in ‘F144’ radicles showed slightly decreased expression abundance. It is assumed that GB counteracts these inhibitory effects and, as such, is able to alleviate the inhibition of tomato growth induced by salt stress.
Conclusions
This study provides new insights into the response of two cultivars of tomato seedlings differing in their tolerance to salt stress, and emphasizes the power and efficiency of a proteomic approach in plant biology studies. This study also indicates that the responsive proteins comprise six functional categories and that many of these proteins are preserved in salt-stressed plants. These findings indicate that the overall structure and function of the stress proteins is conserved. Moreover, 13 differential proteins are found to be homologous and 13 differential proteins are found to be different in salt-stressed seedlings of cultivars Patio and ‘F144’, suggesting a degree of organism-specific specialization and generality. A more detailed knowledge of the composition of the salt-stressed tomato proteins paves the way to a better understanding of its assembly, interactions, and functions. By using proteomic and bioinformatic approaches, evidence that supports the assumption that exogenous application of GB to salt-stressed tomato seedlings might be an alternative approach to overcome salinity limitations was presented. The quantitative and qualitative analysis of the tomato differentially expressed proteins under salt stress is an important step towards further elucidation of salt tolerance mechanisms and the improvement of tomato resistance to salinity by overexpressing key salt stress proteins or the knockdown of some proteins inhibiting the stress intensity.
Supplementary data
Supplementary data are available at JXB online.
Supplementary Tables S1–S4 list the identification of tomato protein induced during osmotic stresses, the type and relationship of protein–protein interactions in biological networks generated for salt stress, and the fold changes in tomato seedling under salt stress as compared with non-salt treated controls after two different staining methods.
Supplementary Material
Acknowledgments
We thank Dr Josip Lovrić and Dr Apolinar Maya-Mendoza (Faculty of Life Sciences, University of Manchester, UK) for critical reading of the manuscript. The analysis of 2D images was performed at Dr Josip Lovrić’s lab.
References
- Alian A, Altman A, Heuer B. Genotypic difference in salinity and water stress tolerance of fresh market tomato cultivars. Plant Science. 2000;152:59–65. [Google Scholar]
- Arnon DJ. Microelements in culture experiments with higher plants. American Journal of Botany. 1938;25:322–340. [Google Scholar]
- Barber J. Photosystem II: a multisubunit membrane protein that oxidizes water. Current Opinion in Structural Biology. 2002;12:523–530. doi: 10.1016/s0959-440x(02)00357-3. [DOI] [PubMed] [Google Scholar]
- Blokhina O, Virolainen E, Fagerstedt KV. Antioxidants, oxidative damage and oxygen deprivation stress: a review. Annals of Botany. 2003;91:179–194. doi: 10.1093/aob/mcf118. [DOI] [PMC free article] [PubMed] [Google Scholar]
- Bugos RC, Hieber AD, Yamamoto HY. Xanthophyll cycle enzymes are members of the lipocalin family, the first identified from plants. Journal of Biological Chemistry. 1998;273:15321–15324. doi: 10.1074/jbc.273.25.15321. [DOI] [PubMed] [Google Scholar]
- Camp WV, Capiau K, Montagu MV, Inzé D, Slooten L. Enhancement of oxidative stress tolerance in transgenic tobacco plants overproducing Fe-superoxide dismutase in chloroplasts. Plant Physiology. 1996;112:1703–1714. doi: 10.1104/pp.112.4.1703. [DOI] [PMC free article] [PubMed] [Google Scholar]
- Chandler PM, Robertson M. Gene expression regulated by abscisic acid and its relation to stress tolerance. Annual Review of Plant Physiology and Plant Molecular Biology. 1994;45:113–141. [Google Scholar]
- Chang WWP, Huang L, Shen M, Webster C, Burlingame AL, Roberts JKM. Patterns of protein synthesis and tolerance of anoxia in root tips of maize seedlings acclimated to a low-oxygen environment and identification of proteins by mass spectrometry. Plant Physiology. 2000;122:295–317. doi: 10.1104/pp.122.2.295. [DOI] [PMC free article] [PubMed] [Google Scholar]
- Chen S, Glazer I, Gollop N, Cash P, Argo E, Innes A, Stewart E, Davidson I, Wilson MJ. Proteomic analysis of the entomopathogenic nematode Steinernema feltiae IS-6IJs under evaporative and osmotic stresses. Molecular and Biochemical Parasitology. 2006;145:195–204. doi: 10.1016/j.molbiopara.2005.10.003. [DOI] [PubMed] [Google Scholar]
- Costa P, Bahrman N, Frigerio JM, Kremer A, Plomion C. Water-deficit-responsive proteins in maritime pine. Plant Molecular Biology. 1998;38:587–596. doi: 10.1023/a:1006006132120. [DOI] [PubMed] [Google Scholar]
- Cutler JM, Rains DW. Effect of water stress and hardening on the internal water relations and osmotic constituents of cotton leaves. Physiologia Plantarum. 1978;2:261–268. [Google Scholar]
- Delauney AJ, Verma DPS. Proline biosynthesis and osmoregulation in plants. The Plant Journal. 1993;4:215–223. [Google Scholar]
- Einset J, Nielsen E, Connolly EL, Bones A, Sparstad T, Winge P, Zhu JK. Membrane-trafficking RabA4c involved in the effect of glycine betaine on recovery from chilling stress in Arabidopsis. Physiologia Plantarum. 2007;130:511–518. [Google Scholar]
- Gorham J. Betaines in higher plants—biosynthesis and role in stress metabolism. In: Wallsgrove RM, editor. Amino acids and their derivatives in higher plants. Cambridge: Cambridge University Press; 1995. pp. 172–203. [Google Scholar]
- Guilick PJ, Dvorak J. Gene induction and repression by salt treatment in roots of the salinity-sensitive Chinese spring wheat and the salinity-tolerant Chinese spring Elytrigia elongata amphiploid. Proceedings of the National Academy of Sciences, USA. 1987;84:99–103. doi: 10.1073/pnas.84.1.99. [DOI] [PMC free article] [PubMed] [Google Scholar]
- Heuer B. Osmoregulatory role of proline in water and salt-stressed plants. In: Pessarakli M, editor. Handbook of pant and crop stress. New York: Marcel Dekker; 1994. pp. 363–381. [Google Scholar]
- Heuer B. Influence of exogenous application of proline and glycinebetaine on growth of salt-stressed tomato plants. Plant Science. 2003;165:693–699. [Google Scholar]
- Hsiao TCE, Acevedo E, Fereres E, Henderson DW. Water stress, growth and osmotic adjustment. Philosophical Transactions of the Royal Society B: Biological Science. 1973;278:479–500. [Google Scholar]
- Ingram J, Bartels D. The molecular basis of dehydration tolerance in plants. Annual Review of Plant Physiology and Plant Molecular Biology. 1996;47:377–403. doi: 10.1146/annurev.arplant.47.1.377. [DOI] [PubMed] [Google Scholar]
- Itai C, Paleg LG. Responses of water-stressed Hordeum distichum L. and Cucumis sativus to proline and betaine. Plant Science Letters. 1982;25:329–335. [Google Scholar]
- Jensen-Jarolim E, Santner B, Leitner A, Grimm R, Scheiner O, Ebner C, Breiteneder H. Bell peppers (Capsicum annuum) express allergens (profilin, pathogenesis-related protein P23 and Bet v 1) depending on the horticultural strain. International Archives of Allergy and Immunology. 1998;116:103–109. doi: 10.1159/000023932. [DOI] [PubMed] [Google Scholar]
- Kawasaki S, Miyake C, Kohchi T, Fujii S, Uchida M, Yokota A. Response of wild watermelon to drought stress: accumulation of an ArgE homologue and citrulline in leaves during water deficits. Plant and Cell Physiology. 2000;41:864–873. doi: 10.1093/pcp/pcd005. [DOI] [PubMed] [Google Scholar]
- Kishitani S, Watanabe K, Yasuda S, Arakawa K, Takabe T. Accumulation of glycinebetaine during cold acclimation and freezing tolerance in leaves of winter and spring barley. Plant, Cell and Environment. 1994;17:89–95. [Google Scholar]
- Kusvuran S, Yasar F, Ellialtioglu S, Abak K. Utilizing some of screening methods in order to determine tolerance of salt stress in the melon (Cucumis melo L.) Research Journal of Agriculture and Biological Sciences. 2007;3:40–45. [Google Scholar]
- Maas EV. Salt tolerance of plants. Appied Agricultural Research. 1986;1:12–26. [Google Scholar]
- Makela P, Peltonen-Sainio P, Jokinen K, Pehu E, Setala H, Hinkkanen R, Somersalo S. Uptake and translocation of foliar-applied glycinebetaine in crop plants. Plant Science. 1996;121:221–230. [Google Scholar]
- Mamedov MD, Hayashi H, Wada H, Mohanty PS, Papageorgious CC, Murata N. Glycinebetaine enhances and stabilizes the evolution of oxygen and the synthesis of ATP by cyanobacterial thylakoid membranes. FEBS Letters. 1991;294:271–274. doi: 10.1016/0014-5793(91)81446-f. [DOI] [PubMed] [Google Scholar]
- Martinez V, Cerda A, Fernandez FG. Salt tolerance of four tomato hybrids. Plant and Soil. 1987;97:233–242. [Google Scholar]
- McCue KF, Hanson AD. Drought and salt tolerance: towards understanding and application. Trends in Biotechnology. 1990;8:358–362. [Google Scholar]
- Morgan JM. Osmoregulation and water stress in higher plants. Annual Review of Plant Physiology. 1984;35:299–319. [Google Scholar]
- Mundree SG, Baker B, Mowla S, Peters S. Physiological and molecular insights into drought tolerance. African Journal of Biotechnology. 2002;1:28–38. [Google Scholar]
- Munns R, Termaat A. Whole-plant responses to salinity. Australian Journal of Plant Physiology. 1986;13:143–160. [Google Scholar]
- Ndimba BK, Chivasa S, Simon WJ, Slabas AR. Identification of Arabidopsis salt and osmotic stress responsive proteins using two-dimensional difference gel electrophoresis and mass spectrometry. Proteomics. 2005;5:4185–4196. doi: 10.1002/pmic.200401282. [DOI] [PubMed] [Google Scholar]
- Neale AD, Wahleitner JA, Lund M, Bonnett HT, Kelly A, Meeks-Wagner DR, Peacock WJ, Dennis ES. Chitinase, beta-1,3-glucanase, osmotin, and extensin are expressed in tobacco plants during flower formation. The Plant Cell. 1990;2:673–684. doi: 10.1105/tpc.2.7.673. [DOI] [PMC free article] [PubMed] [Google Scholar]
- Neuhoff V, Arold N, Taube D. Improved staining of proteins in polyacrylamide gels including isoelectric-focusing gels with clear background at nanogram sensitivity using Coomassie Brilliant Blue G-250 and R-250. Electrophoresis. 1988;9:255–262. doi: 10.1002/elps.1150090603. [DOI] [PubMed] [Google Scholar]
- Ohnishi N, Murata N. Glycinebetaine counteracts the inhibitory effects of salt stress on the degradation and synthesis of d1 protein during photoinhibition in Synechococcus sp. PCC 7942. Plant Physiology. 2006;141:758–765. doi: 10.1104/pp.106.076976. [DOI] [PMC free article] [PubMed] [Google Scholar]
- Parker R, Flowers TJ, Moore AL, Harpham NVJ. An accurate and reproducible method for proteome profiling of the effects of salt stress in the rice leaf lamina. Journal of Experimental Botany. 2006;57:1109–1118. doi: 10.1093/jxb/erj134. [DOI] [PubMed] [Google Scholar]
- Rahman MS, Miyake H, Takeoka Y. Effects of exogenous glycinebetaine on growth and ultrastructure of salt-stressed rice seedlings (Oryza sativa L.) Plant Production Science. 2002;5:33–34. [Google Scholar]
- Rhodes D, Hanson AD. Quartenary ammonium and tertiary sulfonium compounds in higher plants. Annual Review of Plant Physiology and Plant Molecular Biology. 1993;44:357–384. [Google Scholar]
- Riccardi F, Gazeau P, de Vienne D, Zivy M. Protein changes in response to progressive water deficit in maize: quantitative variations and polypeptide identification. Plant Physiology. 1998;117:1253–1263. doi: 10.1104/pp.117.4.1253. [DOI] [PMC free article] [PubMed] [Google Scholar]
- Rodrigo I, Vera P, Frank R, Conejero V. Identification of the viroid-induced tomato pathogenesis-related (PR) protein P23 as the thaumatin like tomato protein NP24 associated with osmotic stress. Plant Molecular Biology. 1991;16:931–934. doi: 10.1007/BF00015088. [DOI] [PubMed] [Google Scholar]
- Rospert S, Dubaquie Y, Gautschi M. Nascent-polypeptide-associated complex. Cellular and Molecular Life Science. 2002;59:1632–1639. doi: 10.1007/PL00012490. [DOI] [PMC free article] [PubMed] [Google Scholar]
- Ruban AV, Wentworth M, Yakushevska AE, Andersson J, Lee PJ, Keegstra W, Dekker JP, Boekema EJ, Jansson S, Horton P. Plants lacking the main light-harvesting complex retain photosystem II macro-organization. Nature. 2003;421:648–652. doi: 10.1038/nature01344. [DOI] [PubMed] [Google Scholar]
- Salvucci ME, Klein RR. Site-directed mutagenesis of a reactive lysyl residue (Lys-247) of Rubisco activase. Archives of Biochemistry and Biophysics. 1994;314:178–185. doi: 10.1006/abbi.1994.1427. [DOI] [PubMed] [Google Scholar]
- SAS. SAS/STAT user's guide, release 6.12. Cary, NC: SAS Institute Inc; 1988. [Google Scholar]
- Shinozaki K, Yamaguchi-Shinozaki K. Molecular responses to drought and cold stress. Current Opinion in Biotechnology. 1996;7:161–167. doi: 10.1016/s0958-1669(96)80007-3. [DOI] [PubMed] [Google Scholar]
- Shinozaki K, Yamaguchi-Shinozaki K. Gene expression and signal transduction in water-stress response. Plant Physiology. 1997;115:327–334. doi: 10.1104/pp.115.2.327. [DOI] [PMC free article] [PubMed] [Google Scholar]
- Silva P, Thompson E, Bailey S, Kruse O, Mullineaux CW, Robinson C, Mann NH, Nixon PJ. FtsH is involved in the early stages of repair of photosystem II in Synechocystis sp PCC 6803. The Plant Cell. 15:2152–2164. doi: 10.1105/tpc.012609. [DOI] [PMC free article] [PubMed] [Google Scholar]
- Sonneveld C, Welles GHW. Yield and quality of rockwool-grown tomatoes as affected by variations in EC-value and climatic conditions. Plant and Soil. 1988;111:37–42. [Google Scholar]
- Storey R, Walker RR. Citrus and salinity. Scientia Horticulturae. 1999;78:39–81. [Google Scholar]
- Veeranagamallaiah G, Jyothsnakumari G, Hippeswamy M, et al. Proteomic analysis of salt stress responses in foxtail millet (Setaria italica L. cv. Prasad) seedlings. Plant Science. 2008;175:631–641. [Google Scholar]
- Vierling E. The roles of heat shock protein in plants. Annual Review of Plant Physiology and Plant Molecular Biology. 1991;42:579–620. [Google Scholar]
- Wykoff DD, Davies JP, Melis A, Grossman AR. The regulation of photosynthetic electron transport during nutrient deprivation in Chlamydomonas reinhardtii. Plant Physiology. 1998;117:129–139. doi: 10.1104/pp.117.1.129. [DOI] [PMC free article] [PubMed] [Google Scholar]
- Yamamoto Y. Quality control of photosystem II. Plant and Cell Physiology. 2001;42:121–128. doi: 10.1093/pcp/pce022. [DOI] [PubMed] [Google Scholar]
- Yan JX, Wait R, Berkelman T, Harry RA. A modified silver staining protocol for visualization of proteins compatible with matrix-assisted laser desorption/ionization and electrospray ionization-mass spectrometry. Electrophoresis. 2000;21:3666–3672. doi: 10.1002/1522-2683(200011)21:17<3666::AID-ELPS3666>3.0.CO;2-6. [DOI] [PubMed] [Google Scholar]
- Yan S, Tang Z, Su W, Sun W. Proteomic analysis of salt stress-responsive proteins in rice root. Proteomics. 2005;5:235–244. doi: 10.1002/pmic.200400853. [DOI] [PubMed] [Google Scholar]
- Zhang J, Ma H, Feng J, Zeng L, Wang Z, Chen S. Grape berry plasma membrane proteome analysis and its differential expression during ripening. Journal of Experimental Botany. 2008;59:2979–2990. doi: 10.1093/jxb/ern156. [DOI] [PubMed] [Google Scholar]
- Zouni A. Crystal structure of photosystem II from Synechococcus elongatus at 3.8Å resolution. Nature. 2001;409:739–743. doi: 10.1038/35055589. [DOI] [PubMed] [Google Scholar]
Associated Data
This section collects any data citations, data availability statements, or supplementary materials included in this article.


