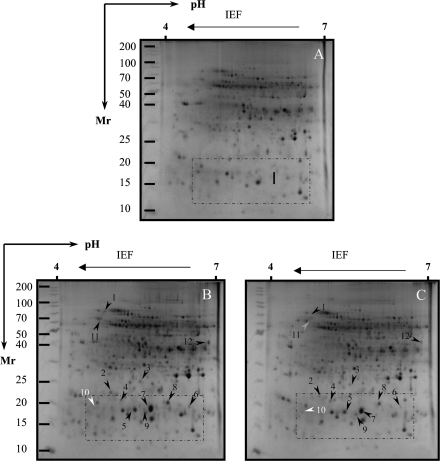
Fig. 2.
Silver-stained 2-D gel protein profiles of radicles from salt-stressed tomato cv. Patio in the presence or absence of exogenous glycinebetaine (GB). (A) Non-saline control; (B) 120 mM NaCl treatment; (C) 120 mM NaCl+5 mM GB treatment. The white and black arrows indicate proteins that showed detectable changes in abundance compared with those seen in the control; white indicates a down-regulated match, and black indicates an up-regulated match. The grey arrow indicates proteins that showed no or slightly detectable changes in abundance compared with those seen in the control. Small boxes indicate the gel regions to be amplified to highlight clear detectable spots in Fig. 6.

