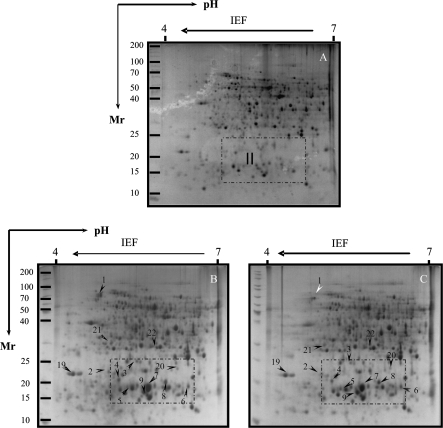
Fig. 4.
Silver-stained 2-D gel protein profiles of radicles from salt-stressed tomato cv. ‘F144’ in the presence or absence of exogenous GB. (A) Non-saline control; (B) 120 mM NaCl treatment; (C) 120 mM NaCl+5 mM GB treatment. The white and black arrows indicate proteins that showed detectable changes in abundance compared with those seen in the control, white indicates a down-regulated match, and black indicates an up-regulated match. Small boxes indicate the gel regions to be amplified to highlight clearly detectable spots in Fig. 6.

